Key takeaways
- It’s critical to analyze like-kind comparables, such as property type, location, income/expense, quality/condition and durability, when looking at cap rates. Factors such as actual or projected income and expenses can also make a big difference.
- While they aren’t considered a primary driver of cap rates, interest rate changes can influence cap rates as the cost of borrowing will impact return on investments.
- Some specific elements that can influence cap rates are property location, condition, asset class, investment size, tenant quality, anticipated rent growth and external economic factors.
In real estate, capitalization rates—commonly called cap rates—are useful risk measurements for commercial properties.
The cap rate formula
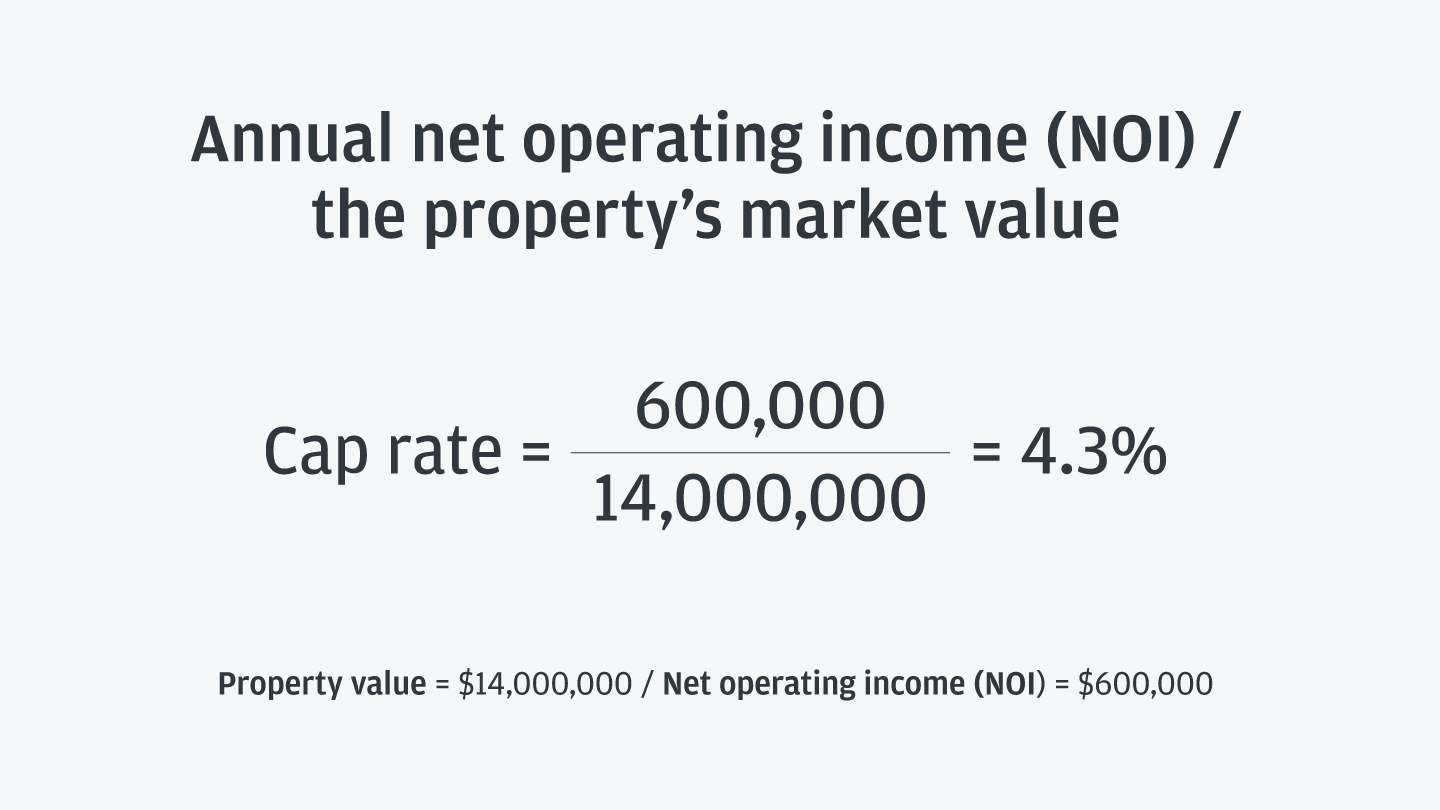
Calculated by dividing a property’s net operating income by its asset value, the cap rate is an assessment of the yield of a property over one year. For example, a property worth $14 million generating $600,000 of NOI would have a cap rate of 4.3%. That means that you can expect a roughly 4.3% annual operating cash flow given the price paid for the property.
You should also note: It’s critical to make an apples-to-apples comparison with cap rates. For example, it matters if you are comparing cap rates based on actual versus projected income.
What’s a good cap rate? It varies from investor to investor and property to property. In general, the higher the cap rate, the greater the risk and return.

Cap rate levels can also reflect other larger economic factors, such as competition, monetary policy, and real estate zoning and regulations.
The impact of interest rates on cap rates
Rising interest rates increase the cost of capital, so fluctuations in the interest rate environment can contribute to rising cap rates.
That’s the case in the current economic environment. Interest rates remained elevated in 2024, increasing financing costs, limiting transaction volume and making it difficult to assess cap rates. Cap rates increased nationally in 2024, but less than in the prior year. Multifamily, industrial and office cap rates increased by 0.4% or more between Q2 of 2023 and Q3 of 2024, compared to 0.8% or more between Q2 of 2022 and Q3 of 2023, according to CoStar data.
The Fed and the market anticipate interest rate cuts in 2025, which would likely lower borrowing costs and decrease cap rates. However, the future of the economy and interest rates is uncertain.
Sample cap rates
| 3Q 24 | Multifamily | Industrial | Office | Retail |
|---|---|---|---|---|
| Los Angeles | 5.00% | 5.30% | 7.30% | 5.50% |
| San Francisco | 4.50% | 5.90% | 6.70% | 5.00% |
| New York | 5.30% | 6.30% | 7.00% | 6.10% |
| Chicago | 6.80% | 8.30% | 9.80% | 7.70% |
| Seattle | 4.90% | 5.90% | 7.30% | 6.00% |
| Portland | 5.50% | 7.10% | 8.30% | 6.60% |
| Washington | 5.60% | 7.40% | 9.20% | 6.50% |
| National | 6.10% | 7.60% | 8.90% | 7.00% |
| 2Q 23 | Multifamily | Industrial | Office | Retail |
|---|---|---|---|---|
| Los Angeles | 4.60% | 4.70% | 6.70% | 5.40% |
| San Francisco | 4.10% | 5.30% | 5.90% | 4.70% |
| New York | 4.90% | 5.70% | 6.40% | 6.00% |
| Chicago | 6.40% | 7.60% | 8.90% | 7.60% |
| Seattle | 4.50% | 5.40% | 6.70% | 6.00% |
| Portland | 5.10% | 6.50% | 7.50% | 6.50% |
| Washington | 5.30% | 6.70% | 8.30% | 6.40% |
| National | 5.70% | 7.00% | 8.10% | 6.90% |
| Change | Multifamily | Industrial | Office | Retail |
|---|---|---|---|---|
| Los Angeles | 0.40% | 0.60% | 0.60% | 0.10% |
| San Francisco | 0.40% | 0.60% | 0.80% | 0.30% |
| New York | 0.40% | 0.60% | 0.60% | 0.10% |
| Chicago | 0.40% | 0.70% | 0.90% | 0.10% |
| Seattle | 0.40% | 0.50% | 0.60% | 0.00% |
| Portland | 0.40% | 0.60% | 0.80% | 0.10% |
| Washington | 0.30% | 0.70% | 0.90% | 0.10% |
| National | 0.40% | 0.60% | 0.80% | 0.10% |
How other macroeconomic factors affect cap rates
Cap rates measure investors’ return expectations, but they’re a forward-looking point-in-time measurement. An investor’s realized returns may differ from their expected ones because of many factors, including:
- Rent growth: Rent growth can accelerate during periods of higher inflation, particularly in apartments with short-term leases. The anticipation of higher rents and greater NOI can offset higher interest rates. Likewise, deteriorating economic conditions can add upward pressure on cap rates and slow rent growth.
- Gross Domestic Product (GDP) and unemployment: Both GDP and unemployment reflect the health of the economy. When GDP is high and unemployment is low, commercial real estate investments tend to have lower cap rates. When GDP is low and unemployment is high, there’s a greater risk associated with investment properties. But remember: Cap rates are typically forward-looking, and individual deals are affected by a building’s unique prospects and an investor’s viewpoint—as well as the prevailing economic conditions and outlook.
- Stage in the economic cycle: In periods of stress, such as the Great Financial Crisis, cap rates have increased while interest rates decreased, a result of investors taking on more risk to own commercial real estate. In expansionary cycles with moderate interest rate increases, cap rates may remain unchanged if investors can expect increases in income and still achieve their expected return over their investment horizon.
- Location: Proximity to the city’s employment center, highways and public transit also influences cap rates. Properties located in high-demand and stable locations generally have lower cap rates, while transitional or outlying neighborhoods usually have higher cap rates due to higher employment volatility and fluctuating demand. This can lead to higher tenant turnover, leasing costs and other factors that impact operating cash flows.
- Asset class: Cap rates vary across asset classes depending on asset fundamentals, performance outlook and supply and demand, among other factors. In recent years, multifamily and industrial properties have exhibited the lowest cap rates. The weight of several economic measurements may also vary based on asset class. For example, personal income is a major factor for multifamily and retail properties, and durable and nondurable goods spending is especially important for industrial properties.
The bottom line
Cap rates are just one unit of comparison used for evaluating commercial real estate; both macroeconomic and property specific characteristics should be considered when determining an appropriate cap rate for any specific property. Various factors, such as supply and demand trends, real estate zoning and regulations, credit worthiness of residents, remaining lease terms and specific lease factors can impact the actual cap rate. An investor’s awareness and diligence can be the differentiator between expectations and outcomes.
Cap rates are among several factors to consider when growing your multifamily portfolio.
JPMorgan Chase Bank, N.A. Member FDIC. Visit jpmorgan.com/cb-disclaimer for disclosures and disclaimers related to this content.


