Contributors

Alan Wynne

Global Investment Strategist

Market Update

U.S. large cap equities are still on pace to finish the week higher despite yesterday’s pullback.

The S&P 500 is higher by +0.1% this week, but the tech-oriented Nasdaq 100 (-0.2%) and small caps (-1.1%) are facing losses. European equities (Stoxx 50 -0.1%) are lagging their U.S. counterparts this week ahead of German general elections and Chinese equities (Hang Seng +3.8%) are heading towards their sixth week in a row of gains.

Investors are taking Walmart’s concerns regarding the uncertainty of consumer behavior as a warning sign. Consumers have been dealing with inflation and elevated borrowing costs and last month’s weaker-than-expected retail sales print is raising questions for the cohort.

Uncertainty has stretched beyond just the consumer this year. To name a few others, advancements in artificial intelligence (AI) challenged the status quo in the field, tariff threats are edging countries closer to trade wars and negotiations aimed at ending the war in Ukraine have highlighted Europe’s need for defense. We discuss the latter in today’s note below.

Global defense implications

This past week featured a flurry of geopolitical headlines which included negotiations between the U.S. and Russia regarding the war in Ukraine. While there is still a tremendous amount of uncertainty, it does seem clear that Europe may bear the price of any peace deal.

Both Vice President JD Vance and Defense Secretary Pete Hegseth suggested at the Munich conference last week that Europe should not rely on the U.S. for security, and President Donald Trump has expressed opposition to deploying U.S. troops as part of any security package for Kyiv. European leaders seem to be getting the message.

Europe has underinvested in defense (the cumulative gap between actual defense spending and the NATO target of 2% of gross domestic product) by approximately 1.8 trillion euros between 1990 and 2021. Notably, around one-third of this shortfall is solely due to Germany, which implemented more significant reductions in defense spending following the conclusion of the Cold War than any other major Western country.

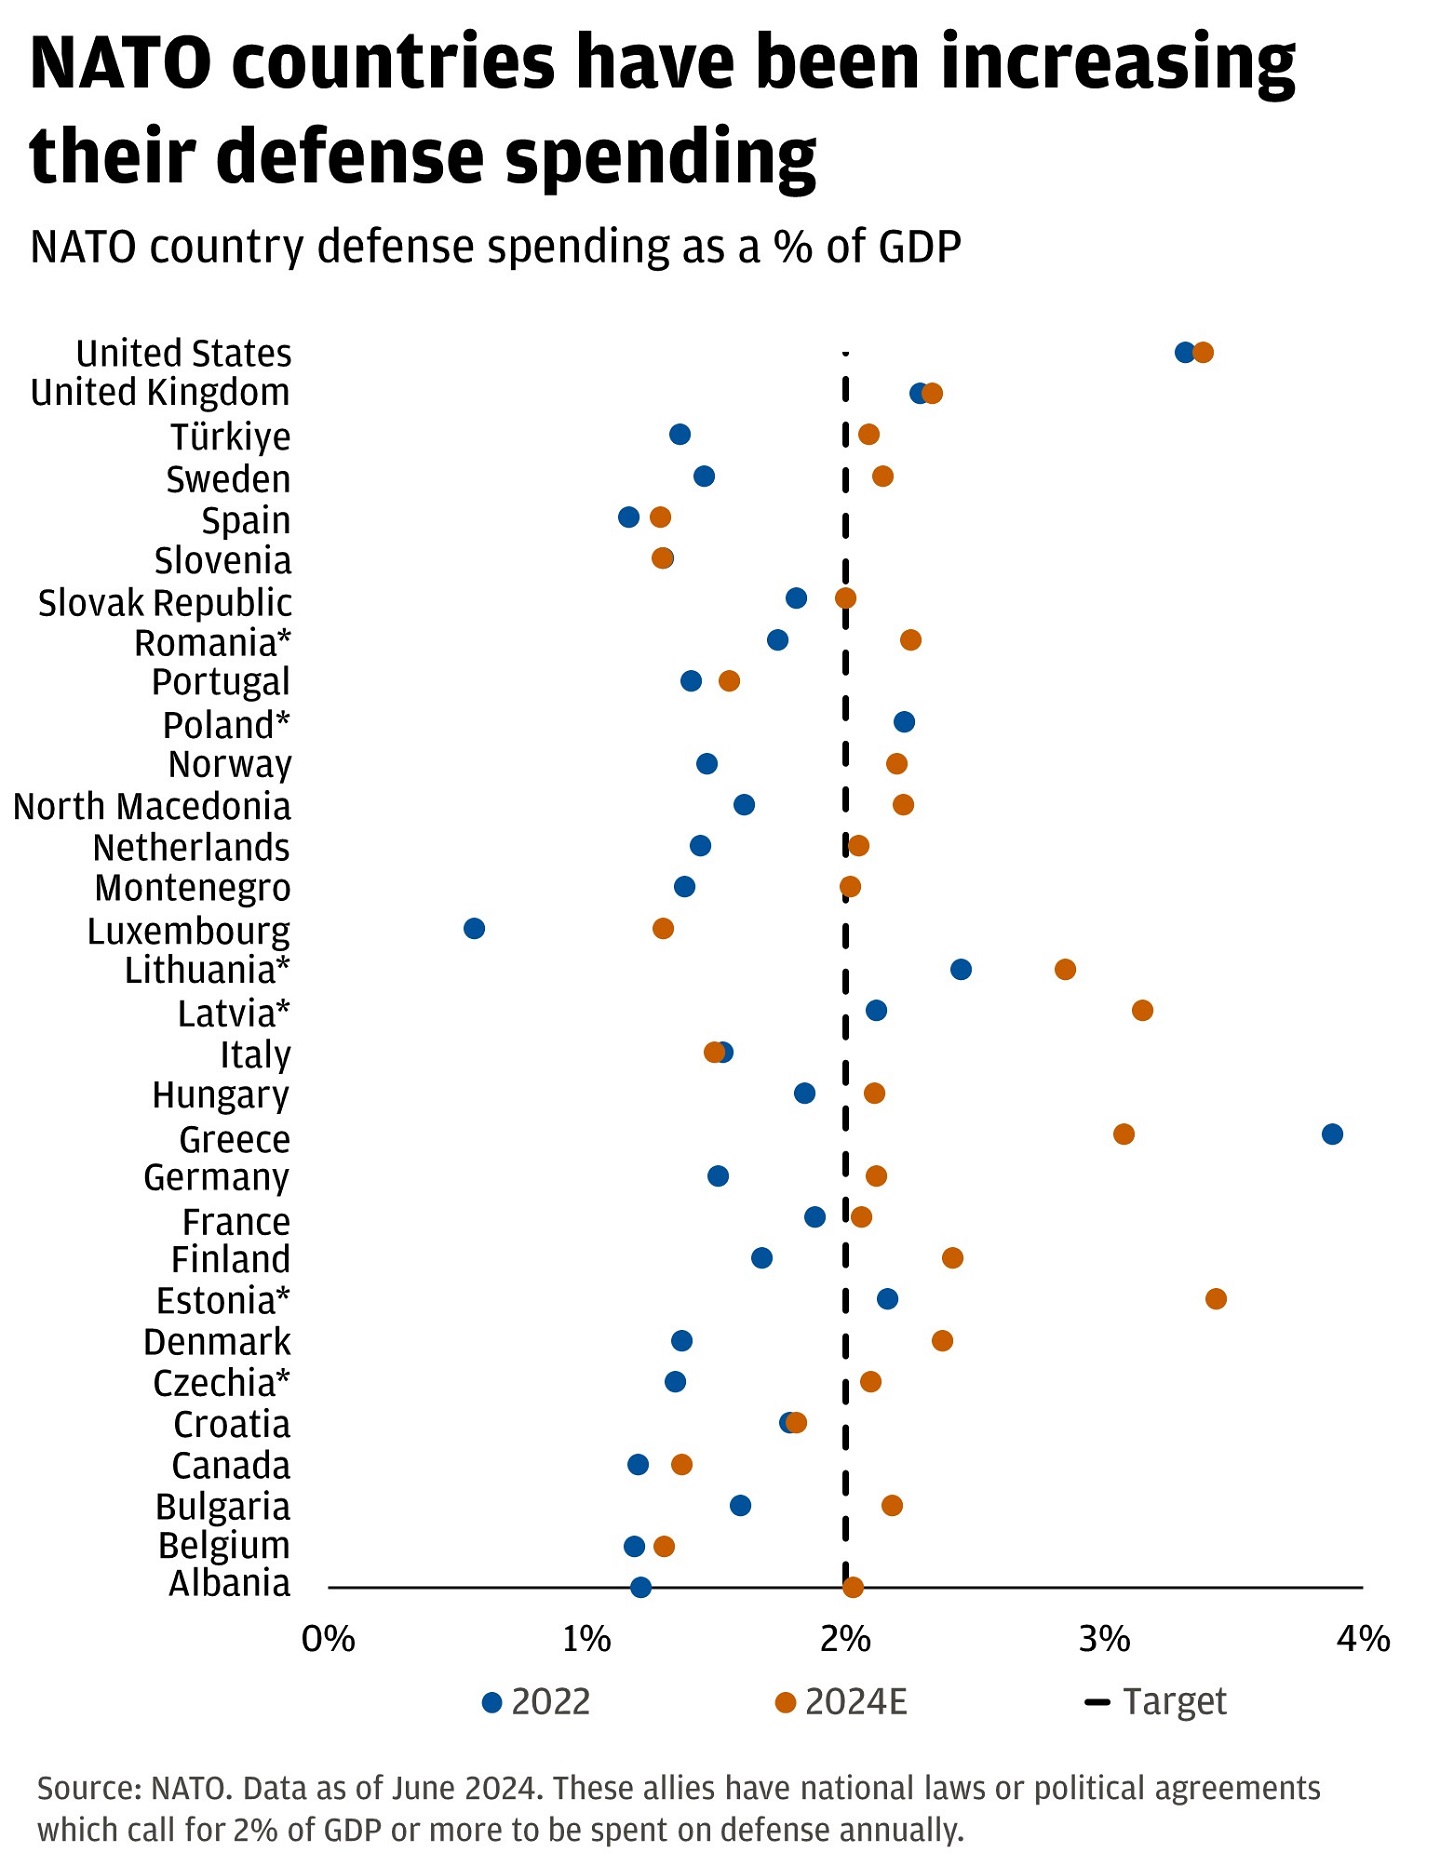
European NATO members have attempted to close this gap and have been ramping up defense budgets, as highlighted in our 2025 Outlook: Building on Strength. Estimates suggest that 71% of NATO members will meet the 2% GDP defense spending target by 2024, up from just 22% in 2022.

The chart displays NATO country defense spending as a percentage of GDP for the years 2022 and 2024 (estimated).

But it seems likely that spending can ramp up further. A Bloomberg article suggested the ultimate price of peace for the EU could be over $3.1 trillion over the next decade. This situation reveals existing fractures within the EU and they face a critical decision: Act collectively with geopolitical influence or prioritize national interests as they navigate the complex dynamics of the Ukraine conflict and their relationship with the U.S.

Investors will get a gauge of how the German voters feel about the situation this weekend during the country’s general election. A key policy priority at stake in the election includes reforming the “debt brake,” which limits Germany’s budget deficit to 0.35% of its GDP. Reforming the debt brake could be critical to enable necessary defense spending. Parties in favor of reform only make up 40% of the current polls, but there could be scope for negotiations given the importance of defense spending.

Election results aside, we anticipate that recent developments in Europe and on their borders will lead to increased investment in security across the region.

What it means for traditional defense: Global armed conflict is at an 80-year high and global trade uncertainty is at its highest level since the Covid-19 pandemic, necessitating resource allocation to traditional defense. In Europe, spending on defense could potentially rise to between 2.5% and 3% of GDP spending, which would likely support domestically produced defense systems and the European industrials sector.

In the U.S., GOP Chairman of the House Armed Services Committee, Mike Rogers, and Senate Armed Services Committee counterpart, Roger Wicker, requested significant defense spending increases. They foresee defense spending reaching 4% of U.S. GDP, up from roughly 3.2% in 2024. Outgoing Defense Secretary Lloyd Austin also proposed higher spending, with a $50 billion increase in 2026 and over $1 trillion by 2028. Given bipartisan support and the increasing global importance of security, defense spending in the U.S. is likely to gain approval, although current Defense Secretary Hegseth’s desire to cut spending at the Pentagon is at odds with the trend.

Security spending will likely extend beyond traditional military expenditures to include securing supply chains, especially for energy resources. Before the Ukraine war, Russia supplied the EU with 21 billion cubic meters of liquefied natural gas (LNG) and 40 billion cubic meters of natural gas through Ukrainian pipelines. That contract ended last year, halting pipeline flows.

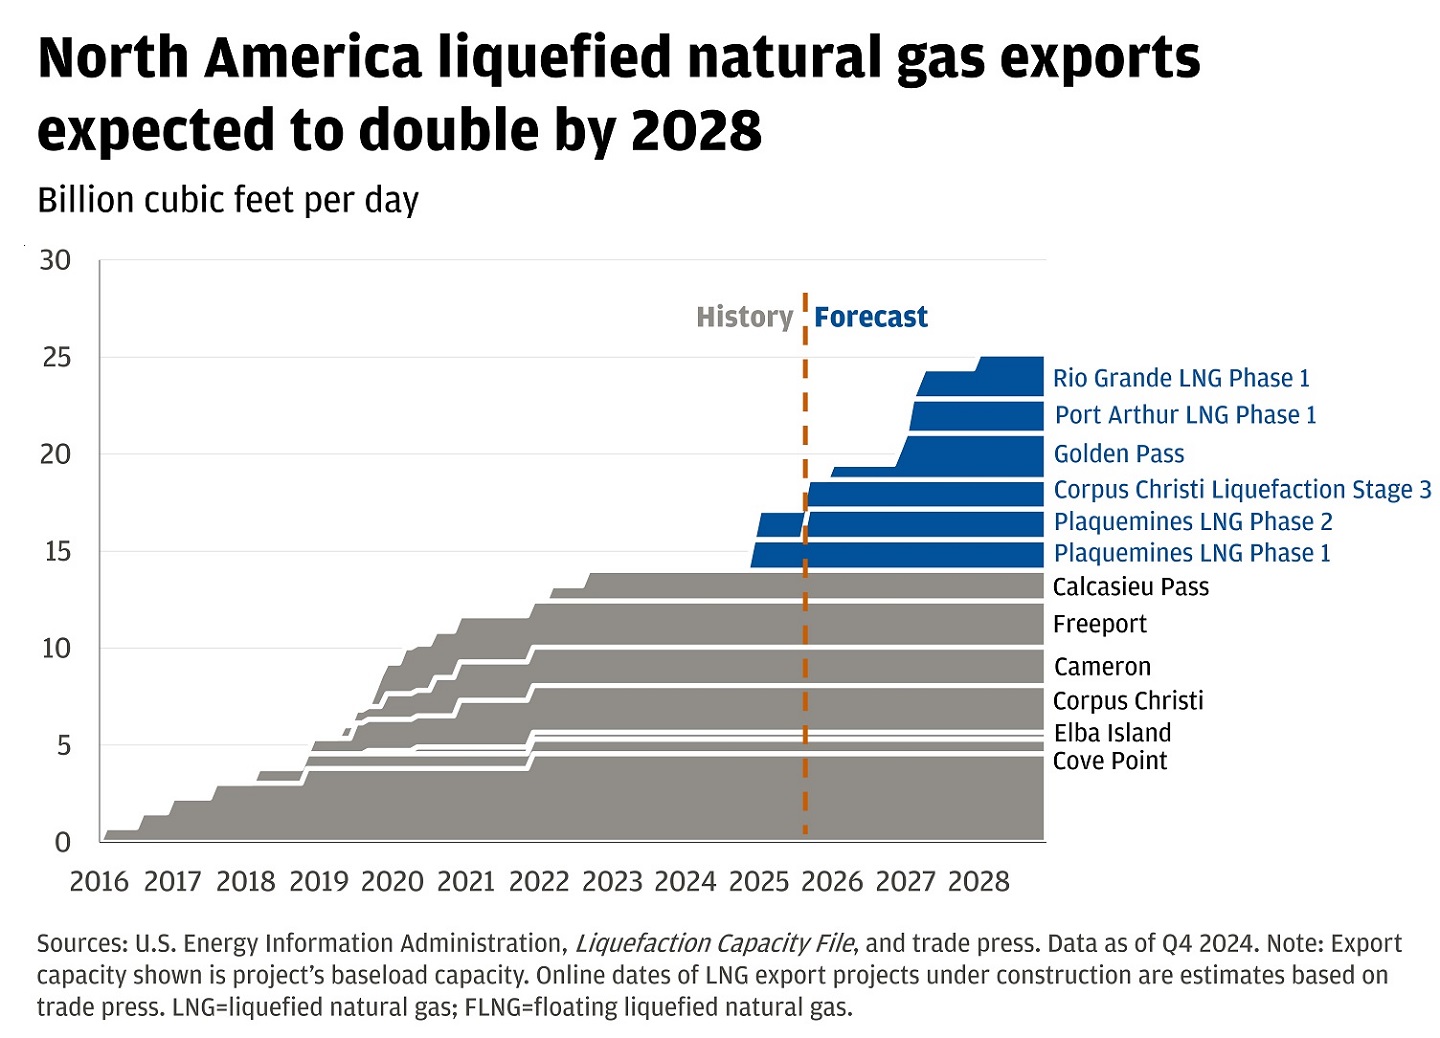
The outstanding question is how reliant Europeans will want to be on Russian natural gas if the war ends. Before the war, Russian energy accounted for 35% of the region’s energy imports. We believe the EU would likely cap this at 20%. The region has increased its LNG regasification capacity by 75 billion cubic meters since the war’s outbreak, while North American export capacity is set to double by 2028. European investment in domestic energy production should continue, but energy independence is unlikely in the near term. Thus, Europe will be focused on diversifying its sources of energy and could even go back to buying Russian gas.

The chart illustrates the historical and forecasted liquefied natural gas (LNG) export capacity for North America from 2016 to 2028, measured in billion cubic feet per day.

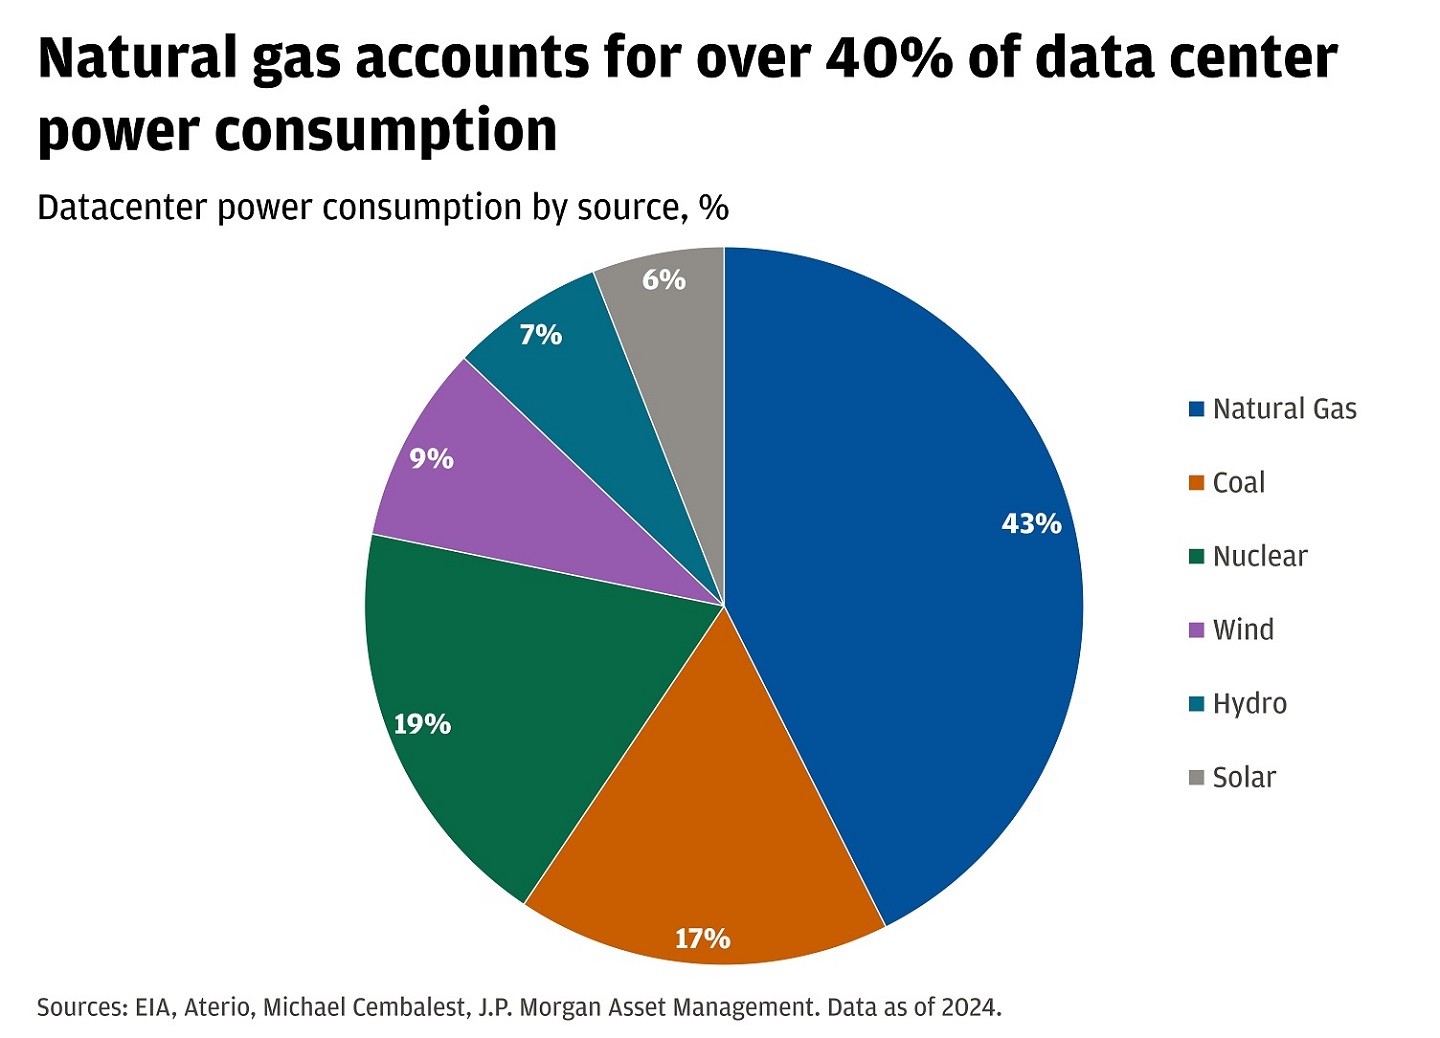
The U.S. is much more energy independent than Europe, but there is a clear need to close the energy gap to support the AI buildout. Our Chairman of Asset and Wealth Management, Michael Cembalest, noted in his outlook that hyperscalers will likely continue to rely on natural gas for power.

The pie chart illustrates the percentage distribution of data center power consumption by energy source for the year 2024.

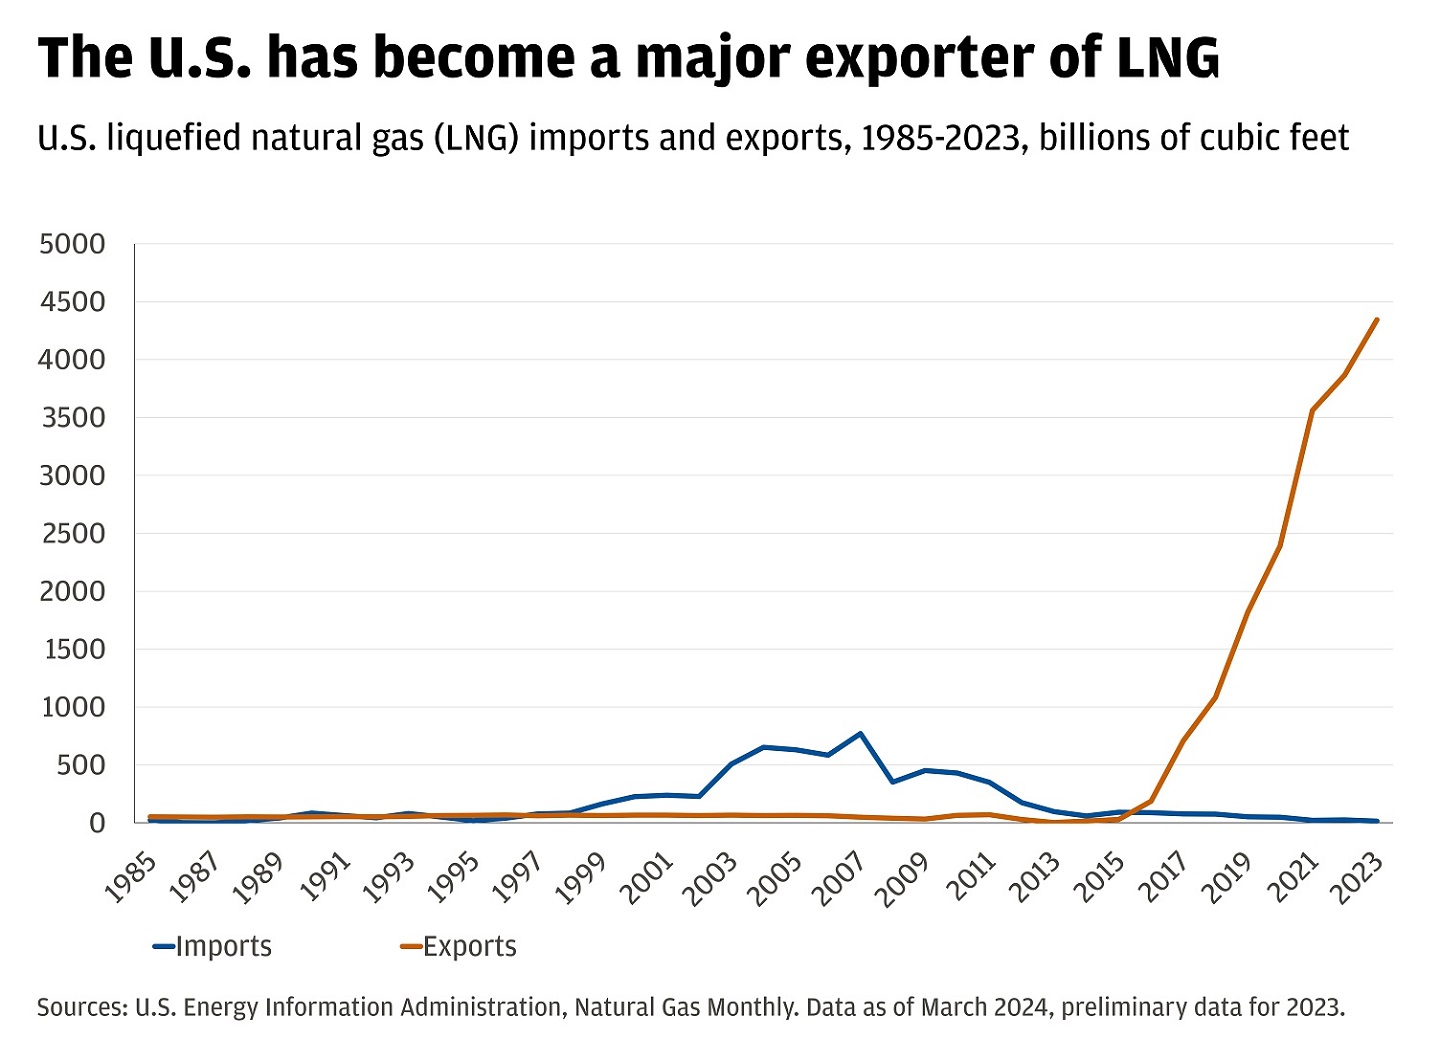
Nuclear projects are years away from providing incremental power and renewable energy (wind and solar) may lose subsidies under the current administration. However, U.S. natural gas production continues to grow and the U.S. has surpassed Qatar and Australia as the top LNG exporter in 2023. By 2030, the U.S. is projected to remain the top exporter, exceeding others by roughly 40%.

The chart depicts U.S. liquefied natural gas (LNG) imports and exports from 1985 to 2023, measured in billions of cubic feet.

What does that mean for portfolios? A continued impulse to spend on security supports select companies across the industrials, materials, energy and utilities sectors in the U.S. and Europe. Private infrastructure assets will also likely remain well supported given existing power demand gaps and a need to diversify energy sources.

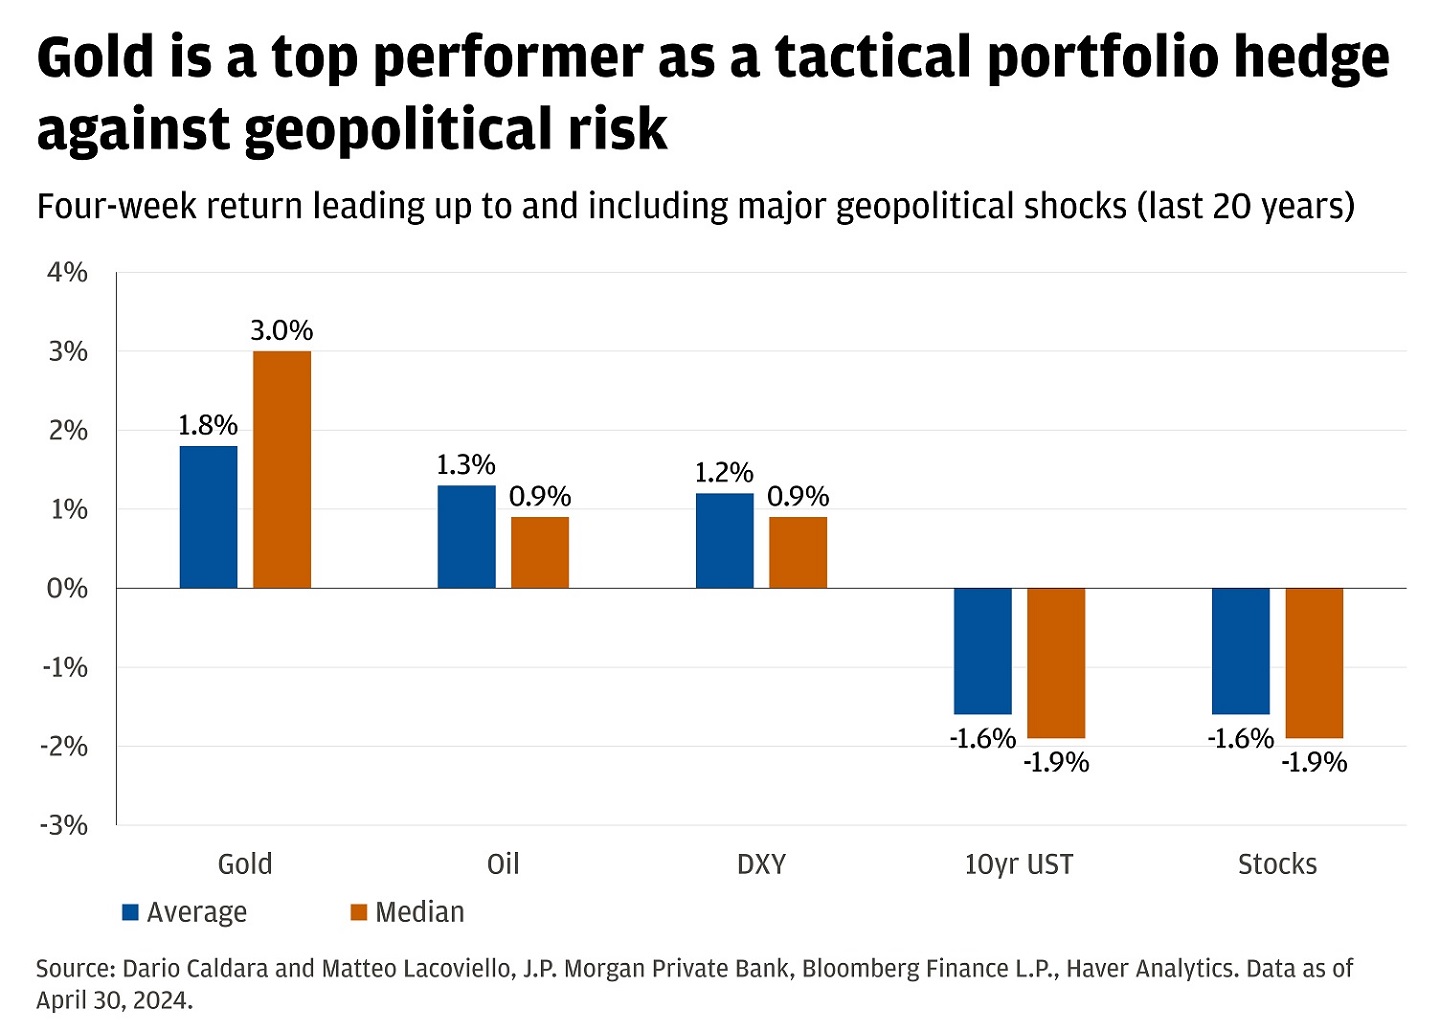
Our preferred hedge against increased geopolitical uncertainty is gold.

The chart shows the average and median four-week returns of different assets leading up to and including major geopolitical shocks over the last 20 years.

We favor gold due to its limited supply (Current estimates, including underground reserves, total 244,040 tons of gold, enough to fill just over three Olympic-sized swimming pools) and continued demand from central banks (according to a 2024 survey by the World Gold Council, 81% of central banks plan to increase gold allocations over the next 12 months, with none planning to decrease).

Looking to lean into the increased security spend across traditional defense, infrastructure and energy? Reach out to your J.P. Morgan advisor to see how these sectors can best fit into your portfolio.

All market and economic data as of 02/21/25 are sourced from Bloomberg Finance L.P. and FactSet unless otherwise stated.

Connect with a Wealth Advisor

Reach out to your Wealth Advisor to discuss any considerations for your current portfolio. If you don’t have a Wealth Advisor, click here to tell us about your needs and we’ll reach out to you.

Connect now

DISCLOSURES

The information presented is not intended to be making value judgments on the preferred outcome of any government decision or political election.

By visiting a third-party site, you may be entering an unsecured website that may have a different privacy policy and security practices from J.P. Morgan standards. J.P. Morgan is not responsible for, and does not control, endorse or guarantee, any aspect of any linked third-party site. J.P. Morgan accepts no direct or consequential losses arising from the use of such sites.​

Index definitions:

Gold: The U.S. Dollar Index (USDX) indicates the general int'l value of the USD. The USDX does this by averaging the exchange rates between the USD and  major world currencies.

Hang Seng: The Hang Seng Index is a free-float capitalization-weighted index of a selection of companies from the Stock Exchange of Hong Kong.

The STOXX® Europe 600 is a broad measure of the European equity market. With a fixed number of 600 components, the index provides extensive and diversified coverage across 17 countries and 11 industries within Europe’s developed economies, representing nearly 90% of the underlying investable market.

The Solactive United States 2000 Index intends to track the performance of the largest 1001 to 3000 companies from the United States stock market. Constituents are selected based on company market capitalization and weighted by free float market capitalization.

The Russell 3000 Index is a capitalization-weighted stock market index that seeks to be a benchmark of the entire U.S. stock market. It measures the performance of the largest 3,000 U.S. companies representing approximately 96% of the investable U.S. equity market.

The S&P 500 Equal Weight Index is the equal-weight version of the widely-used S&P 500. The index includes the same constituents as the capitalization weighted S&P 500, but each company in the S&P 500 EWI is allocated a fixed weight of the index total at each quarterly rebalance.

The Bloomberg U.S. Aggregate Bond Index is a broad-based flagship benchmark that measures the investment grade, US dollar-denominated, fixed-rate taxable bond market. The index includes Treasuries, government-related and corporate securities, MBS (agency fixed-rate pass-throughs), ABS and CMBS (agency and non-agency).

The Magnificent Seven stocks are a group of influential companies in the U.S. stock market: Alphabet, Amazon, Apple, Meta Platforms, Microsoft, NVIDIA, and Tesla.

The Magnificent 7 Index is an equal-dollar weighted equity benchmark consisting of a fixed basket of 7 widely-traded companies (Microsoft, Apple, Nvidia, Alphabet, Amazon, Meta, Tesla) classified in the United States and representing the Communications, Consumer Discretionary and Technology sectors as defined by Bloomberg Industry Classification System (BICS).

The S&P Midcap 400 Index is a capitalization-weighted index which measures the performance of the mid-range sector of the U.S. stock market.

The S&P 500 index is widely regarded as the best single gauge of large-cap U.S. equities and serves as the foundation for a wide range of investment products. The index includes 500 leading companies and captures approximately 80% coverage of available market capitalization.

Bonds are subject to interest rate risk, credit, call, liquidity and default risk of the issuer. Bond prices generally fall when interest rates rise.

Standard and Poor’s 500 Index is a capitalization-weighted index of 500 stocks. The index is designed to measure performance of the broad domestic economy through changes in the aggregate market value of 500 stocks representing all major industries. The index was developed with a base level of 10 for the 1941–43 base period.

The Bloomberg Eco Surprise Index shows the degree to which economic analysts under- or over-estimate the trends in the business cycle. The surprise element is defined as the percentage difference between analyst forecasts and the published value of economic data releases.

The MSCI World Index is a free float-adjusted market capitalization index that is designed to measure global developed market equity performance.

The NASDAQ 100 Index is a basket of the 100 largest, most actively traded U.S companies listed on the NASDAQ stock exchange. The index includes companies from various industries except for the financial industry, like commercial and investment banks. These non-financial sectors include retail, biotechnology, industrial, technology, health care, and others.

The Russell 2000 Index measures small company stock market performance. The index does not include fees or expenses.

We believe the information contained in this material to be reliable but do not warrant its accuracy or completeness. Opinions, estimates, and investment strategies and views expressed in this document constitute our judgment based on current market conditions and are subject to change without notice.

The views, opinions, estimates and strategies expressed herein constitutes the author's judgment based on current market conditions and are subject to change without notice, and may differ from those expressed by other areas of J.P. Morgan. This information in no way constitutes J.P. Morgan Research and should not be treated as such. You should carefully consider your needs and objectives before making any decisions. For additional guidance on how this information should be applied to your situation, you should consult your advisor.

All companies referenced are shown for illustrative purposes only, and are not intended as a recommendation or endorsement by J.P. Morgan in this context.

JPMorgan Chase & Co., its affiliates, and employees do not provide tax, legal or accounting advice. Information presented on these webpages is not intended to provide, and should not be relied on for tax, legal and accounting advice. You should consult your own tax, legal and accounting advisors before engaging in any financial transaction.

RISK CONSIDERATIONS

  • Past performance is not indicative of future results. You may not invest directly in an index.
  • The price of equity securities may rise or fall due to the changes in the broad market or changes in a company's financial condition, sometimes rapidly or unpredictably. Equity securities are subject to 'stock market risk' meaning that stock prices in general may decline over short or extended periods of time.
  • Investing in fixed income products is subject to certain risks, including interest rate, credit, inflation, call, prepayment and reinvestment risk. Any fixed income security sold or redeemed prior to maturity may be subject to substantial gain or loss.
  • In general, the bond market is volatile and bond prices rise when interest rates fall and vice versa. Longer term securities are more prone to price fluctuation than shorter term securities. Any fixed income security sold or redeemed prior to maturity may be subject to substantial gain or loss. Dependable income is subject to the credit risk of the issuer of the bond. If an issuer defaults no future income payments will be made.
  • When investing in mutual funds or exchange-traded and index funds, please consider the investment objectives, risks, charges, and expenses associated with the funds before investing. You may obtain a fund’s prospectus by contacting your investment professional. The prospectus contains information, which should be carefully read before investing.
  • Investors should understand the potential tax liabilities surrounding a municipal bond purchase. Certain municipal bonds are federally taxed if the holder is subject to alternative minimum tax. Capital gains, if any, are federally taxable. The investor should note that the income from tax-free municipal bond funds may be subject to state and local taxation and the alternative minimum tax (amt).
  • International investments may not be suitable for all investors. International investing involves a greater degree of risk and increased volatility. Changes in currency exchange rates and differences in accounting and taxation policies outside the u.s. can raise or lower returns. Some overseas markets may not be as politically and economically stable as the united states and other nations. Investments in international markets can be more volatile.
  • Investments in emerging markets may not be suitable for all investors. Emerging markets involve a greater degree of risk and increased volatility. Changes in currency exchange rates and differences in accounting and taxation policies outside the u.s. can raise or lower returns. Some overseas markets may not be as politically and economically stable as the united states and other nations. Investments in emerging markets can be more volatile.
  • Investments in commodities may have greater volatility than investments in traditional securities, particularly if the instruments involve leverage. The value of commodity-linked derivative instruments may be affected by changes in overall market movements, commodity index volatility, changes in interest rates, or factors affecting a particular industry or commodity, such as drought, floods, weather, livestock disease, embargoes, tariffs and international economic, political and regulatory developments. Use of leveraged commodity-linked derivatives creates an opportunity for increased return but, at the same time, creates the possibility for greater loss.
  • Real estate investments trusts may be subject to a high degree of market risk because of concentration in a specific industry, sector or geographical sector. Real estate investments may be subject to risks including, but not limited to, declines in the value of real estate, risks related to general and economic conditions, changes in the value of the underlying property owned by the trust and defaults by borrower.
  • Investment in alternative investment strategies is speculative, often involves a greater degree of risk than traditional investments including limited liquidity and limited transparency, among other factors and should only be considered by sophisticated investors with the financial capability to accept the loss of all or part of the assets devoted to such strategies.
  • Structured products involve derivatives and risks that may not be suitable for all investors. The most common risks include, but are not limited to, risk of adverse or unanticipated market developments, issuer credit quality risk, risk of lack of uniform standard pricing, risk of adverse events involving any underlying reference obligations, risk of high volatility, risk of illiquidity/little to no secondary market, and conflicts of interest. Before investing in a structured product, investors should review the accompanying offering document, prospectus or prospectus supplement to understand the actual terms and key risks associated with the each individual structured product. Any payments on a structured product are subject to the credit risk of the issuer and/or guarantor. Investors may lose their entire investment, i.e., incur an unlimited loss. The risks listed above are not complete. For a more comprehensive list of the risks involved with this particular product, please speak to your J.P. Morgan team.
  • As a reminder, hedge funds (or funds of hedge funds) often engage in leveraging and other speculative investment practices that may increase the risk of investment loss. These investments can be highly illiquid, and are not required to provide periodic pricing or valuation information to investors, and may involve complex tax structures and delays in distributing important tax information. These investments are not subject to the same regulatory requirements as mutual funds; and often charge high fees. Further, any number of conflicts of interest may exist in the context of the management and/or operation of any such fund. For complete information, please refer to the applicable offering memorandum.
  • For informational purposes only -- J.P. Morgan Securities LLC does not endorse, advise on, transmit, sell or transact in any type of virtual currency. Please note: J.P. Morgan Securities LLC does not intermediate, mine, transmit, custody, store, sell, exchange, control, administer, or issue any type of virtual currency, which includes any type of digital unit used as a medium of exchange or a form of digitally stored value.
  • The prices and rates of return are indicative, as they may vary over time based on market conditions.
  • Additional risk considerations exist for all strategies.
  • The information provided herein is not intended as a recommendation of or an offer or solicitation to purchase or sell any investment product or service.
  • Opinions expressed herein may differ from the opinions expressed by other areas of J.P. Morgan. This material should not be regarded as investment research or a J.P. Morgan investment research report.

This material is for information purposes only, and may inform you of certain products and services offered by J.P. Morgan’s wealth management businesses, part of JPMorgan Chase & Co. (“JPM”). The views and strategies described in the material may not be suitable for all investors and are subject to investment risks. Please read all Important Information.

GENERAL RISKS & CONSIDERATIONS. Any views, strategies or products discussed in this material may not be appropriate for all individuals and are subject to risks. Investors may get back less than they invested, and past performance is not a reliable indicator of future results. Asset allocation/diversification does not guarantee a profit or protect against loss. Nothing in this material should be relied upon in isolation for the purpose of making an investment decision. You are urged to consider carefully whether the services, products, asset classes (e.g. equities, fixed income, alternative investments, commodities, etc.) or strategies discussed are suitable to your needs. You must also consider the objectives, risks, charges, and expenses associated with an investment service, product or strategy prior to making an investment decision. For this and more complete information, including discussion of your goals/situation, contact your J.P. Morgan team.

NON-RELIANCE. Certain information contained in this material is believed to be reliable; however, JPM does not represent or warrant its accuracy, reliability or completeness, or accept any liability for any loss or damage (whether direct or indirect) arising out of the use of all or any part of this material. No representation or warranty should be made with regard to any computations, graphs, tables, diagrams or commentary in this material, which are provided for illustration/reference purposes only. The views, opinions, estimates and strategies expressed in this material constitute our judgment based on current market conditions and are subject to change without notice. JPM assumes no duty to update any information in this material in the event that such information changes. Views, opinions, estimates and strategies expressed herein may differ from those expressed by other areas of JPM, views expressed for other purposes or in other contexts, and this material should not be regarded as a research report. Any projected results and risks are based solely on hypothetical examples cited, and actual results and risks will vary depending on specific circumstances. Forward-looking statements should not be considered as guarantees or predictions of future events.

Nothing in this document shall be construed as giving rise to any duty of care owed to, or advisory relationship with, you or any third party. Nothing in this document shall be regarded as an offer, solicitation, recommendation or advice (whether financial, accounting, legal, tax or other) given by J.P. Morgan and/or its officers or employees, irrespective of whether or not such communication was given at your request. J.P. Morgan and its affiliates and employees do not provide tax, legal or accounting advice. You should consult your own tax, legal and accounting advisors before engaging in any financial transactions.

LEGAL ENTITY, BRAND & REGULATORY INFORMATION

In the United States, bank deposit accounts and related services, such as checking, savings and bank lending, are offered by JPMorgan Chase Bank, N.A. Member FDIC.

J.P. Morgan Wealth Management is a business of JPMorgan Chase & Co., which offers investment products and services through J.P. Morgan Securities LLC (JPMS), a registered broker-dealer and investment adviser, member FINRA and SIPC. Insurance products are made available through Chase Insurance Agency, Inc. (CIA), a licensed insurance agency, doing business as Chase Insurance Agency Services, Inc. in Florida. Certain custody and other services are provided by JPMorgan Chase Bank, N.A. (JPMCB). JPMS, CIA and JPMCB are affiliated companies under the common control of JPMorgan Chase & Co. Products not available in all states.

Bank deposit accounts and related services, such as checking, savings and bank lending, are offered by JPMorgan Chase Bank, N.A. Member FDIC.

This document may provide information about the brokerage and investment advisory services provided by J.P. Morgan Securities LLC (“JPMS”). The agreements entered into with JPMS, and corresponding disclosures provided with respect to the different products and services provided by JPMS (including our Form ADV disclosure brochure, if and when applicable), contain important information about the capacity in which we will be acting. You should read them all carefully. We encourage clients to speak to their JPMS representative regarding the nature of the products and services and to ask any questions they may have about the difference between brokerage and investment advisory services, including the obligation to disclose conflicts of interests and to act in the best interests of our clients.

J.P. Morgan may hold a position for itself or our other clients which may not be consistent with the information, opinions, estimates, investment strategies or views expressed in this document. JPMorgan Chase & Co. or its affiliates may hold a position or act as market maker in the financial instruments of any issuer discussed herein or act as an underwriter, placement agent, advisor or lender to such issuer.