
Contributors
Thomas Kennedy
Chief Investment Strategist, J.P. Morgan Private Bank
Jay Serpe
Global Head of Alternative Investments, Strategy & Business Development, J.P. Morgan Private Bank
Global Investment Strategist, J.P. Morgan Wealth Management
The menacing commercial real estate (CRE) headlines just won’t stop. “U.S. office prices headed for ‘severe crash.”1 “Wall Street braces for commercial real estate time bomb.”2
The headlines suggest things will likely get worse. We disagree.
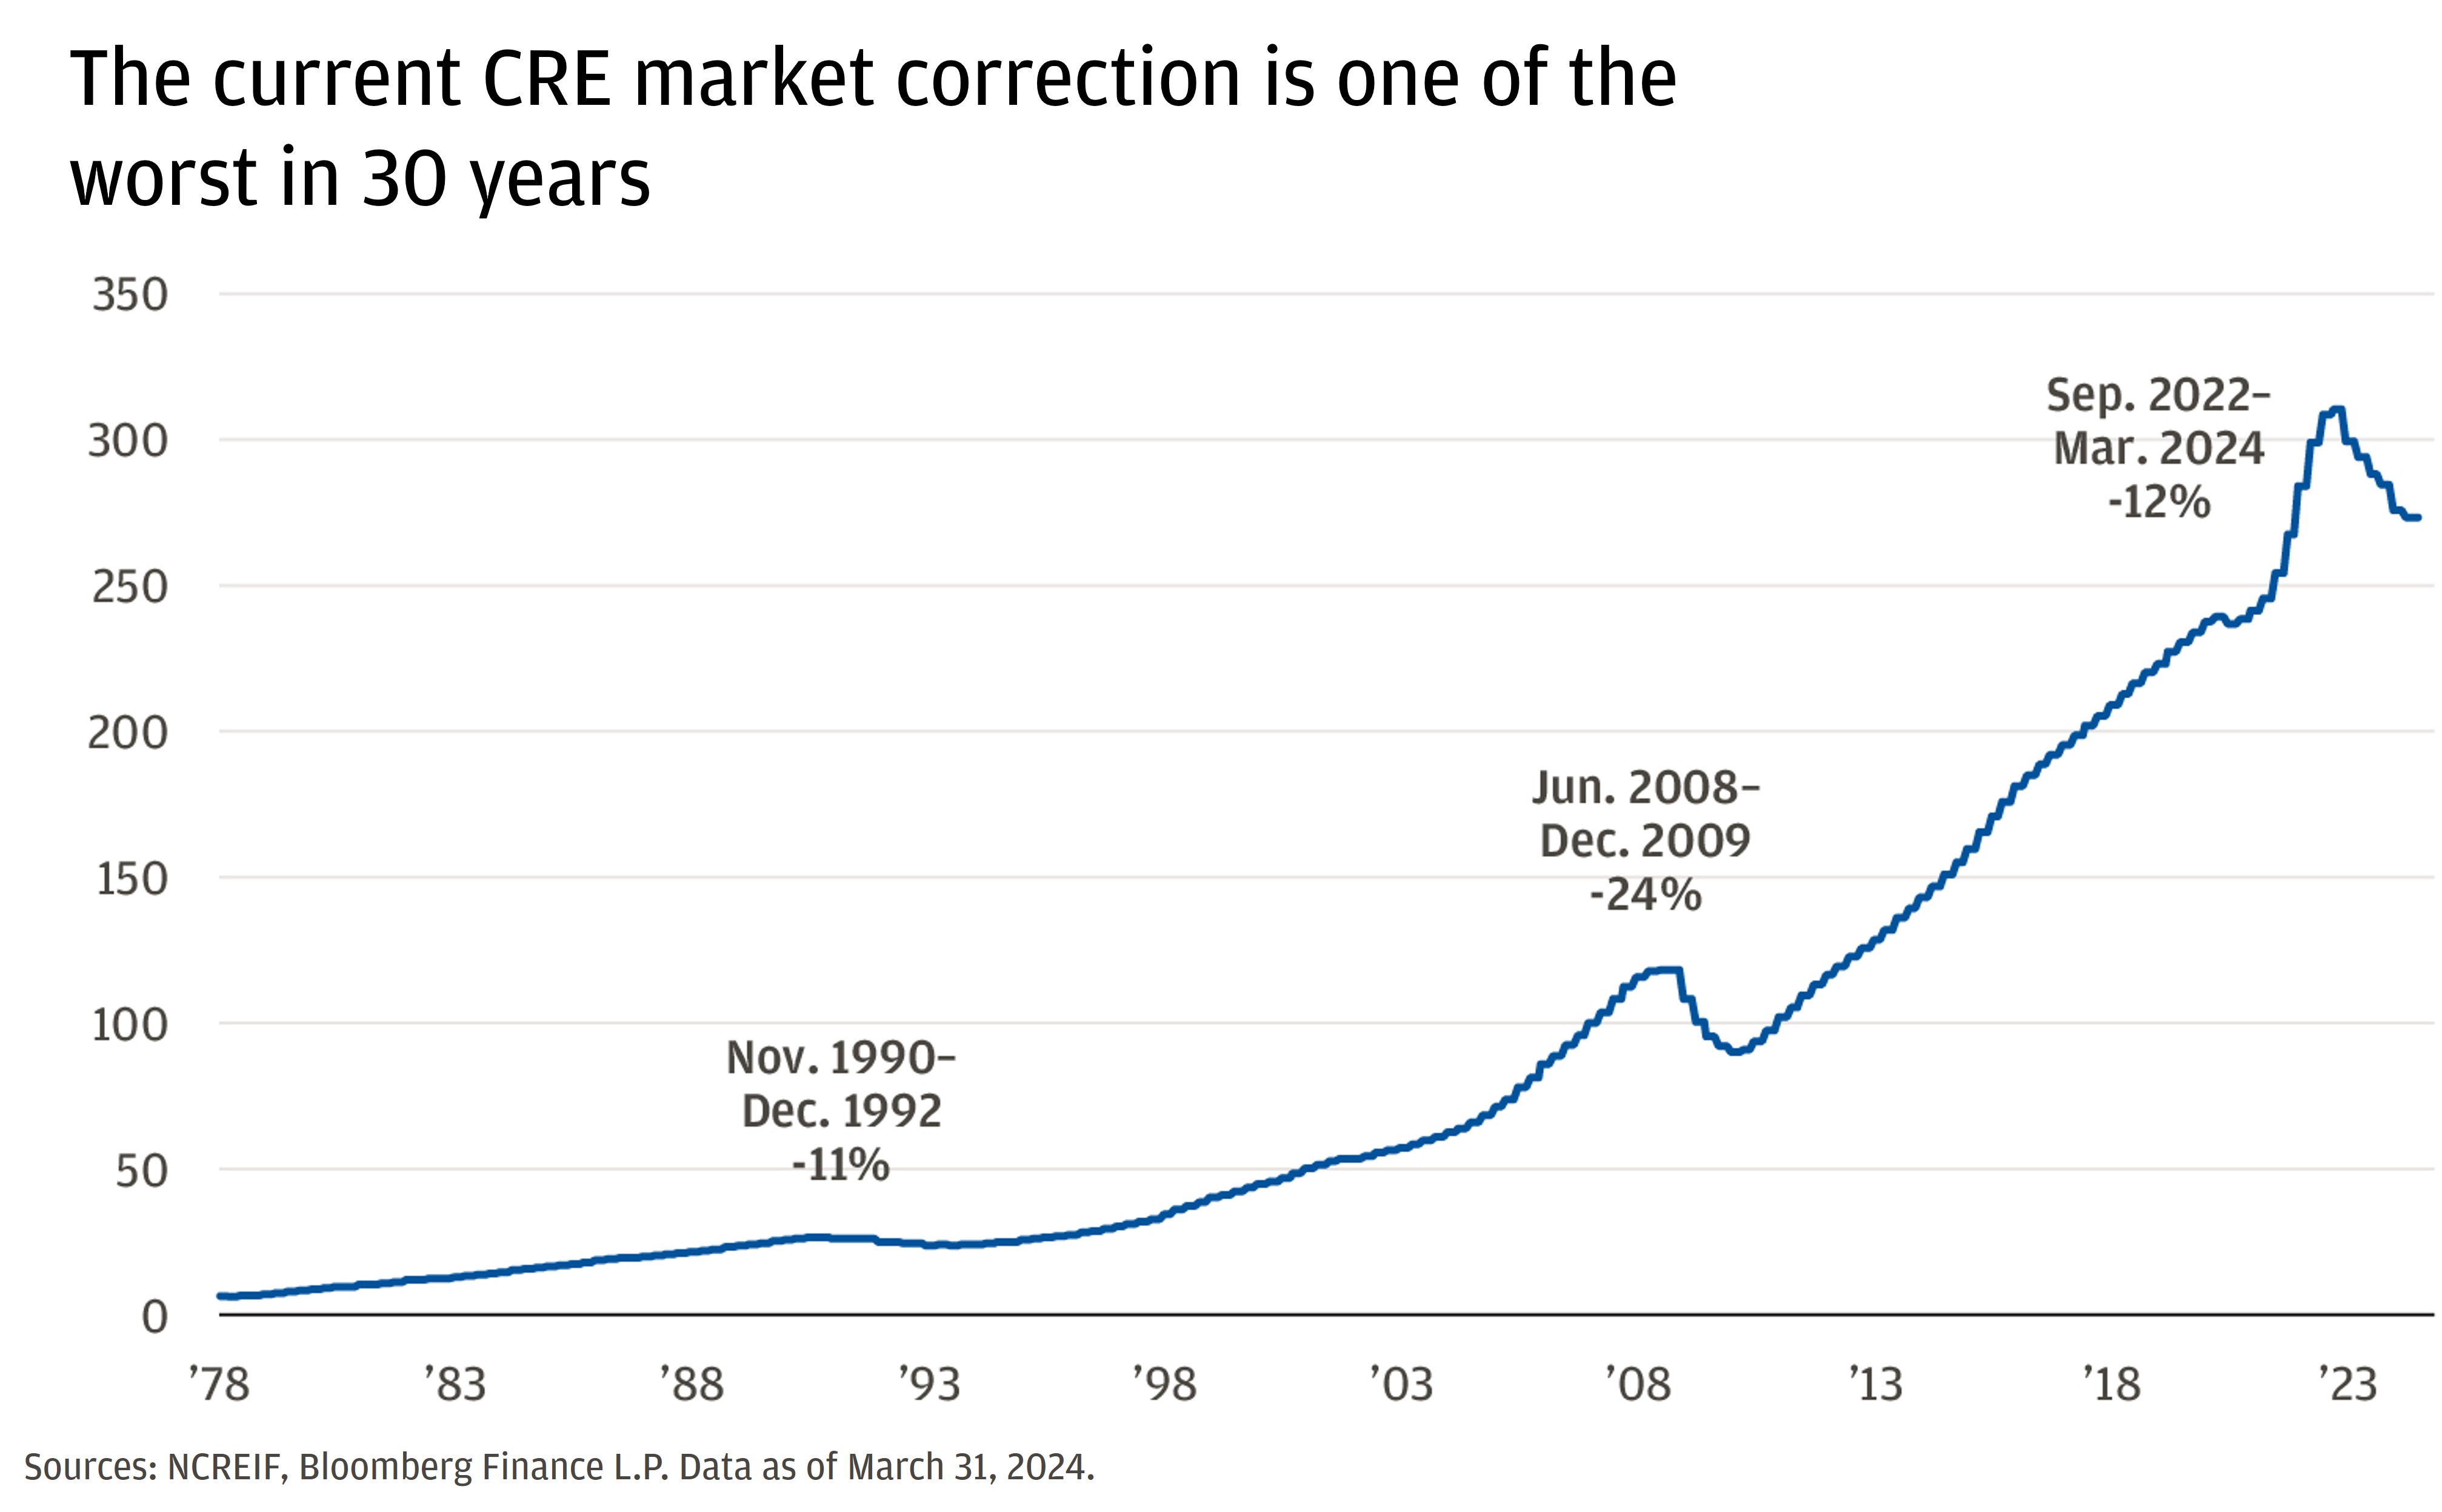
CRE property prices have fallen 12%, in aggregate, since peaking in 2022. Following the fastest Federal Reserve (Fed) hiking cycle since the early 1980s, the market experienced its third correction in 30 years. “Zombie offices”3 are faring the worst as work from home erodes office usage, but other asset classes are declining as well.
We are optimistic on the potential opportunities during this pullback. Here are three reasons:
1. This CRE drawdown is unique
Property values have fallen, but cash flows have remained resilient.
Capitalization rates (cap rates) are the standard CRE market metric for comparing relative value across real estate investments. (A cap rate of 5% means a property is expected to generate annual income – or cash flow – equal to 5% of its purchase price).4
An investor would have paid 20 times that cash flow (called a multiple) for the property.5 Higher cap rates (or lower multiples) suggest potentially greater returns.
The question for investors is: Have cap rates risen enough, or is cash income high enough to justify the risk?
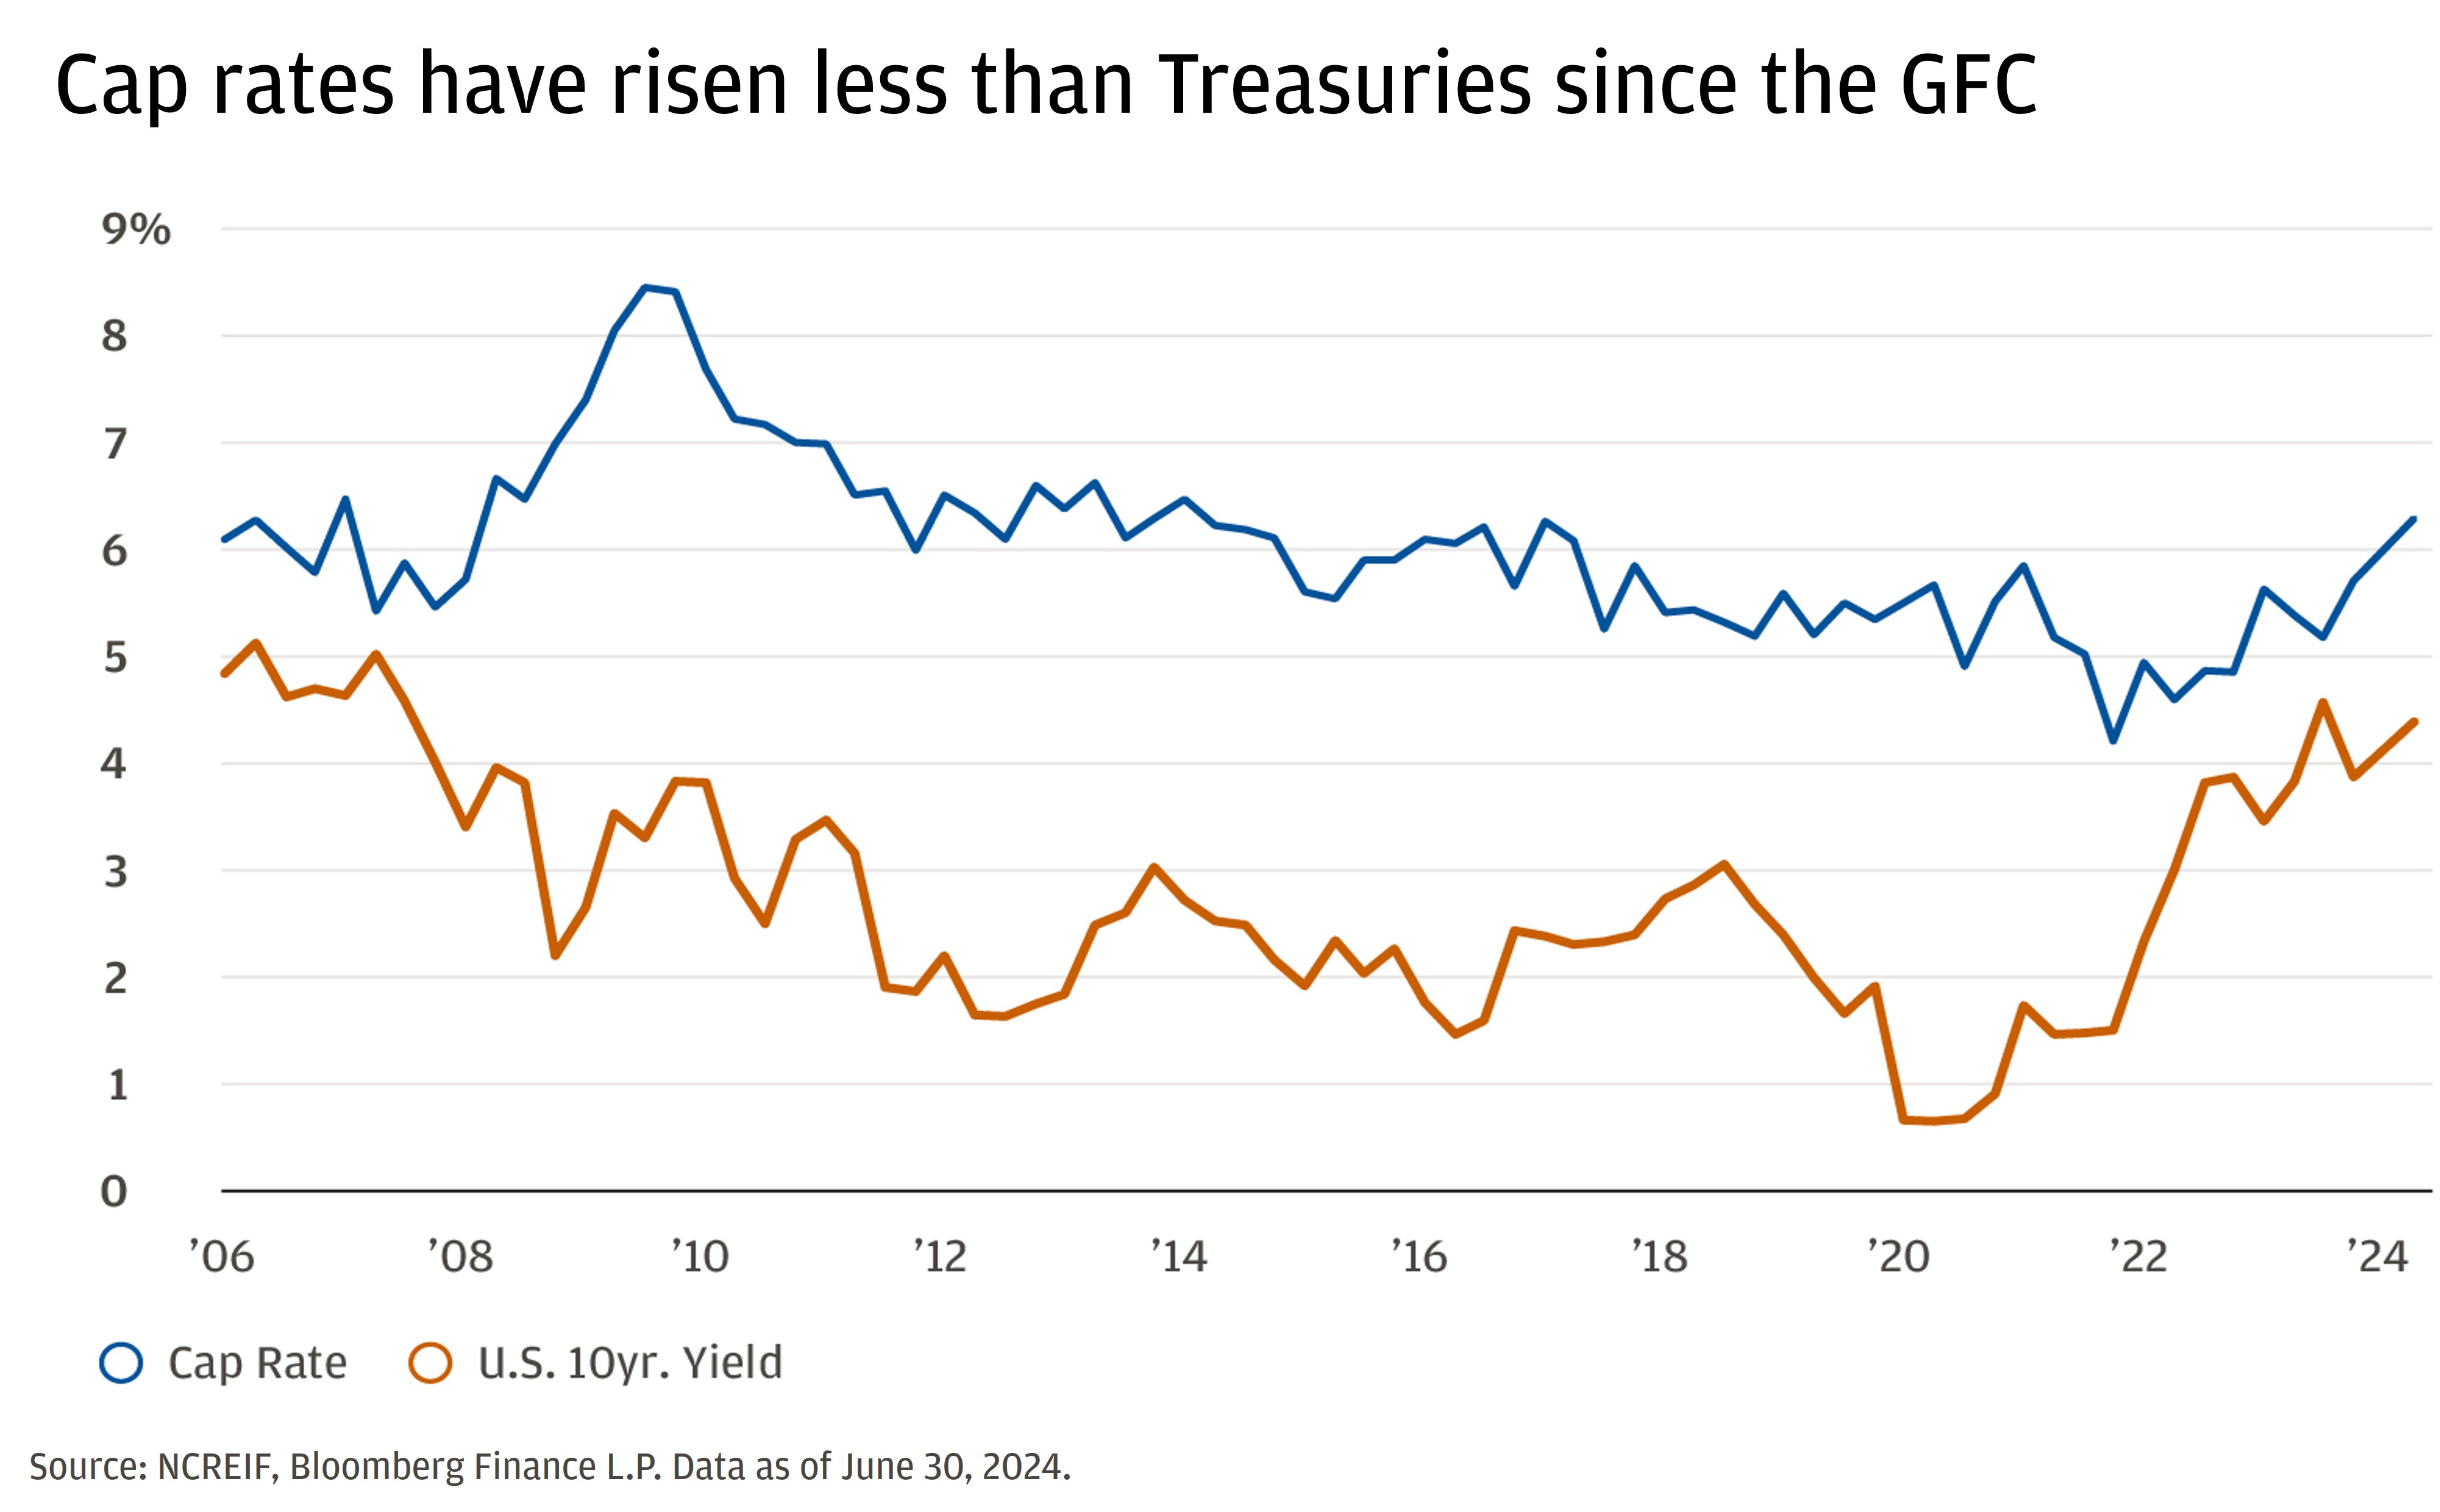
A common way to assess the risk-reward balance in CRE is comparing real estate cap rates with Treasury yields. Today, this comparison might lead investors to think that CRE is overpriced.
The spread between Treasuries and CRE cap rates is currently at one of its narrowest levels since the 2008 Global Financial Crisis (GFC). This suggests that investors are receiving too little compensation for the additional risk they take on by buying real estate versus Treasuries, which are considered a risk-free security.
But much as you would not decide to buy or sell equities based purely on their price-to-earnings ratios, you would not decide to invest in CRE based on the cap rate alone.
We believe cash flows can remain resilient
Let’s consider the fundamentals in the CRE market: cash flow versus valuation.
Cash flow, known as net operating income (NOI), is rental income after expenses. Today, the returns from cash flows are robust. Despite the dramatic headlines, cash flows are in line with prior cycle peaks. Historically, CRE cash flows have fallen with, or even ahead of, valuations. That has not happened this time.
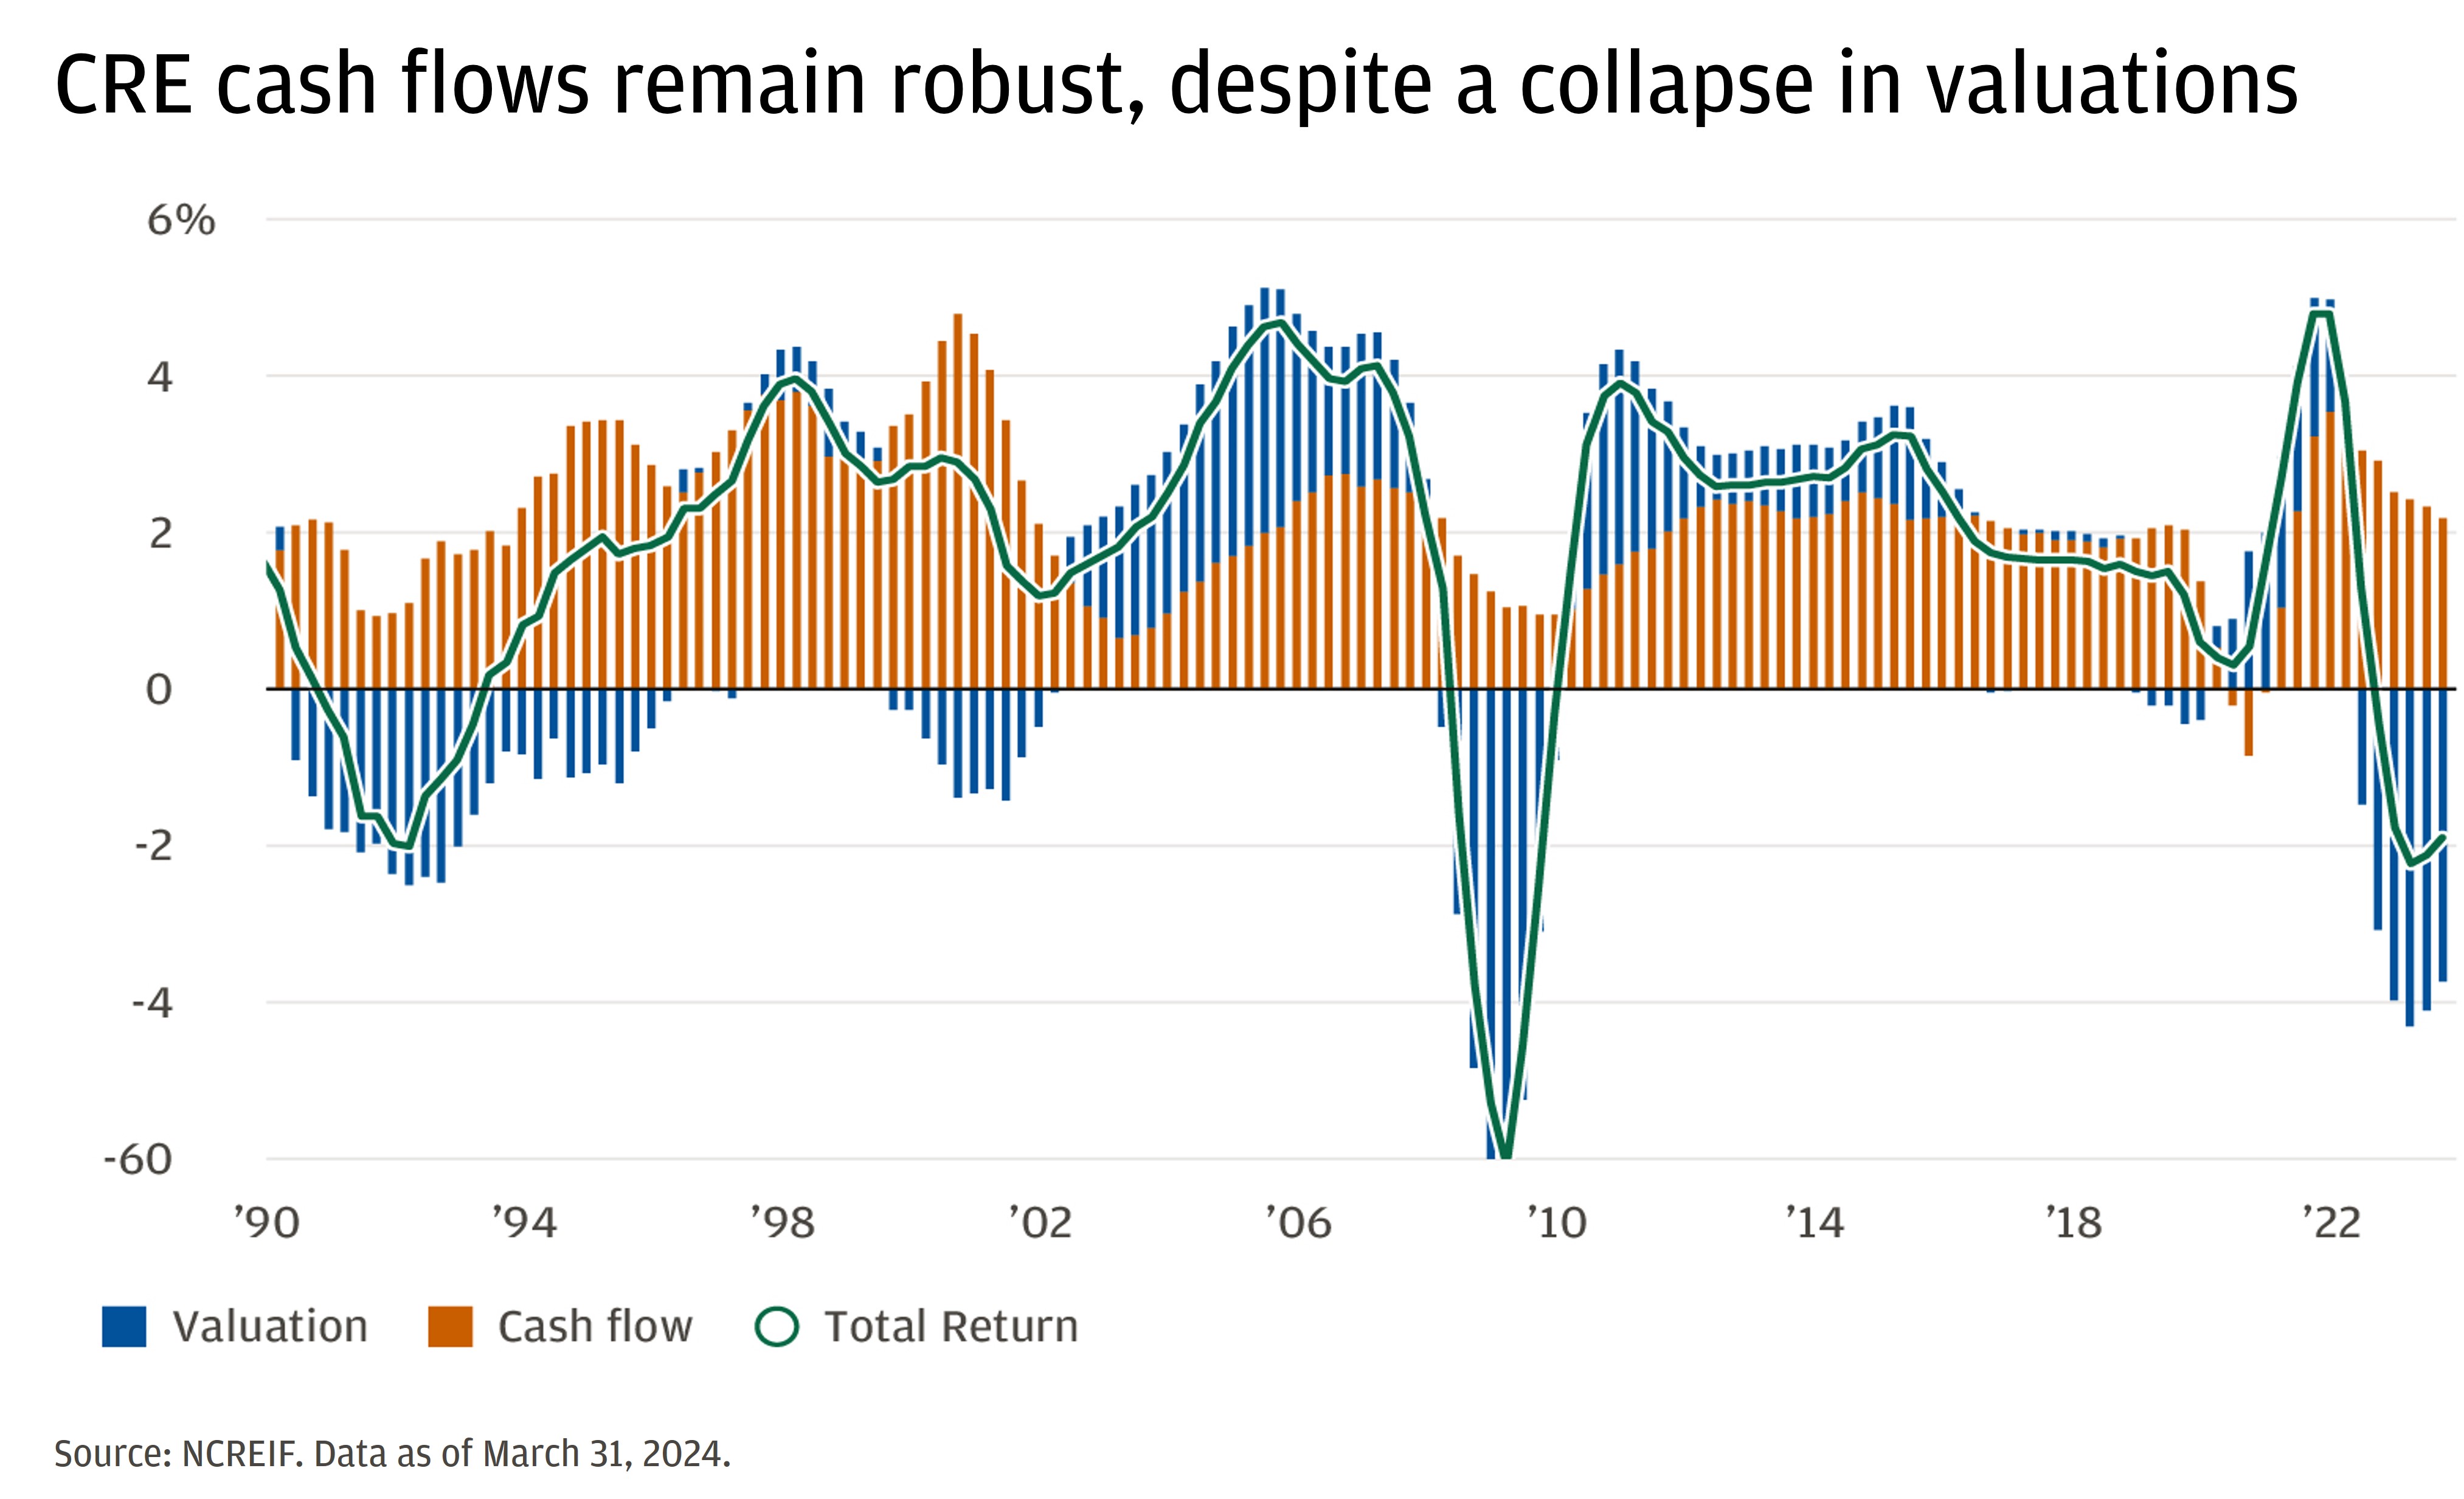
Will cash flows fall to meet valuations, or will valuations rise to meet cash flows? We expect the latter, where cash flows remain resilient and valuations gradually rise. Rental income is based on the supply of properties and the demand from tenants. CRE supply and demand currently point to higher prices moving forward.
Supply is connected to anticipated demand (construction takes time) and the cost to develop. The most aggressive hiking cycle in decades made those costs surge, dramatically slowing new property construction. New single- and multi-family residential construction projects are now 13% below their 2022 peaks.6 Retail, industrial and office are down 75% from their peaks.7 Supply will likely be crimped for a few years, which should support prices charged by property owners and translate into higher cash flows.
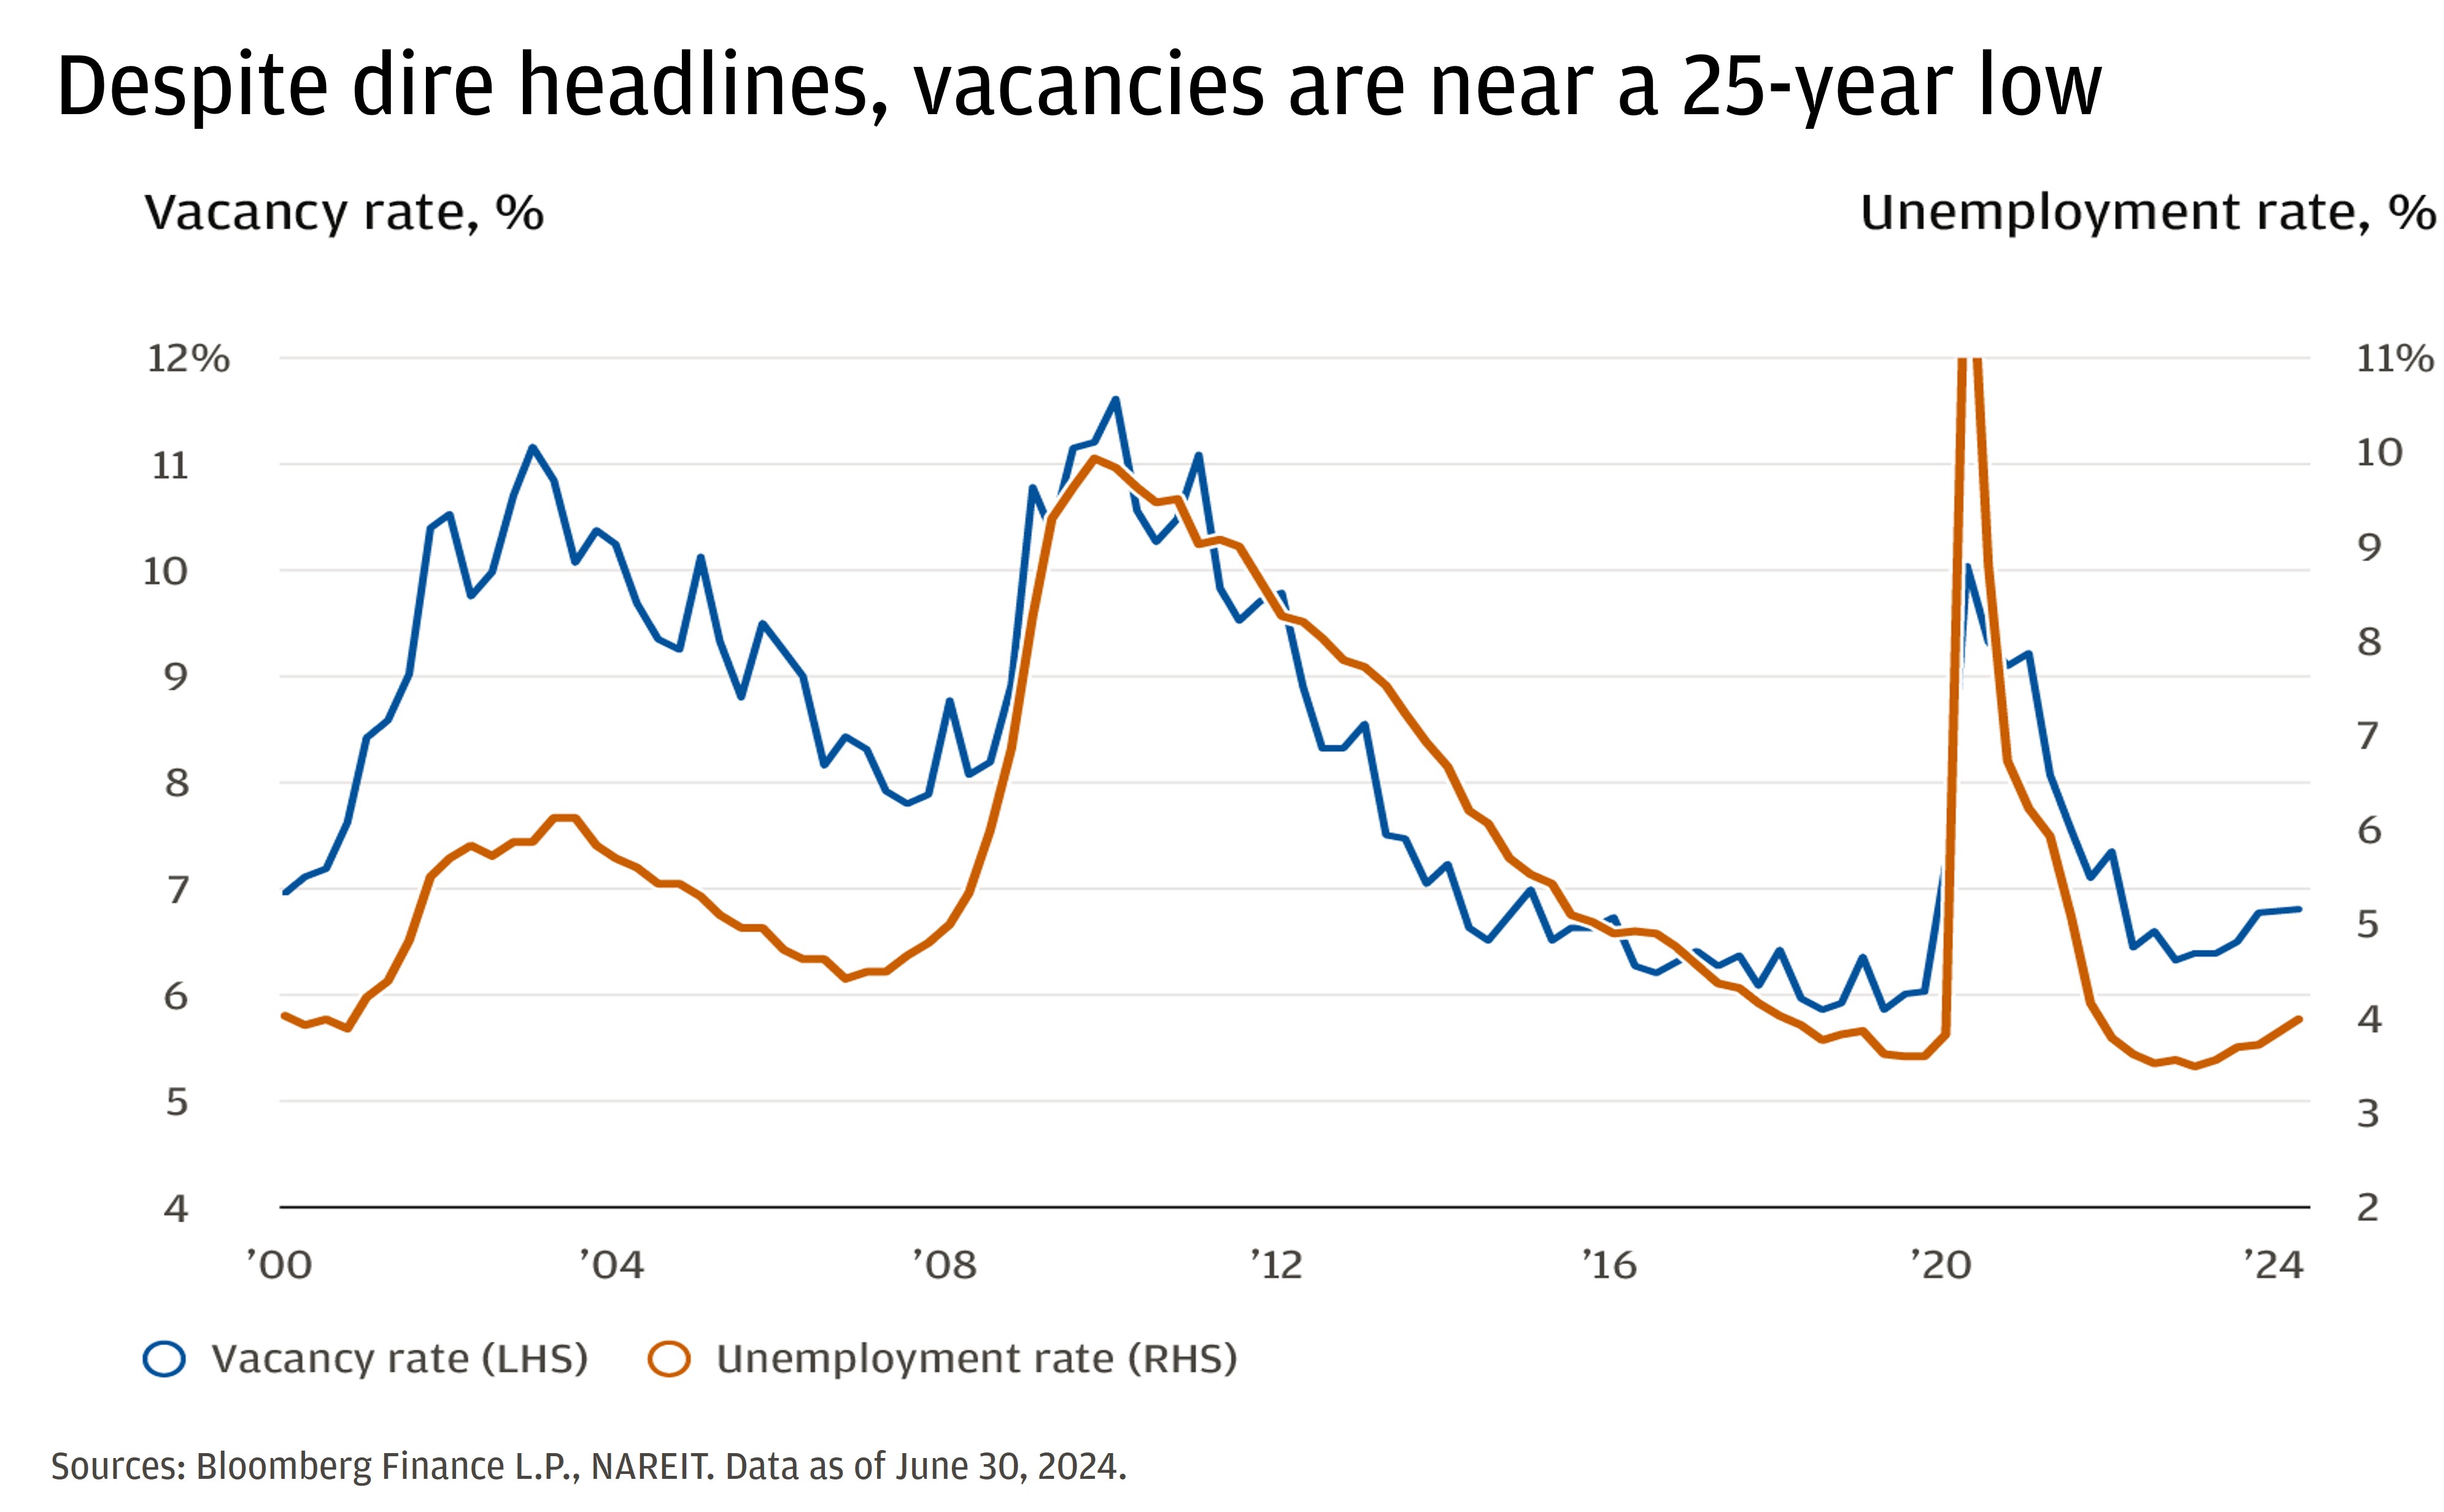
Demand: The U.S. economy has been strong despite the Fed rate hikes; in fact, the economy is near full capacity, given an approximately 4% unemployment rate. Employment and income drive demand for housing, and about 5% CRE vacancies are near the lowest levels of the last 25 years.
Valuations should improve following Fed rate cuts
A property’s price, or valuation, is based on a transaction or an appraisal (an estimate). CRE valuations are driven by the cash flows that properties generate. They are also affected by two other components: the discount rate on those cash flows (derived from interest rates), and leverage (how much the owner borrowed). Leverage and credit availability can make or break real estate investments. Typically, these three components move together, but a unique feature of this market is that they have not.
We’re seeing fewer buyers and sellers in the market today as a result of high interest rates. The volume of CRE transactions has dropped well below pre-COVID levels. As for credit availability, lenders are shortening loan terms, raising the proportion of loans expiring in the next two years. This has led to more delinquencies, particularly in office.
So amid resilient cash flows, these other two components should improve as the Fed initiates its rate-cutting cycle in the back half of 2024.
2. The CRE market is not a monolith
There is significant variation across asset types, locations and property qualities. One useful metric we track8 shows widening dispersion between the office, industrial, retail and residential sectors. Vacancy rate dispersion and NOI dispersion are also widening.
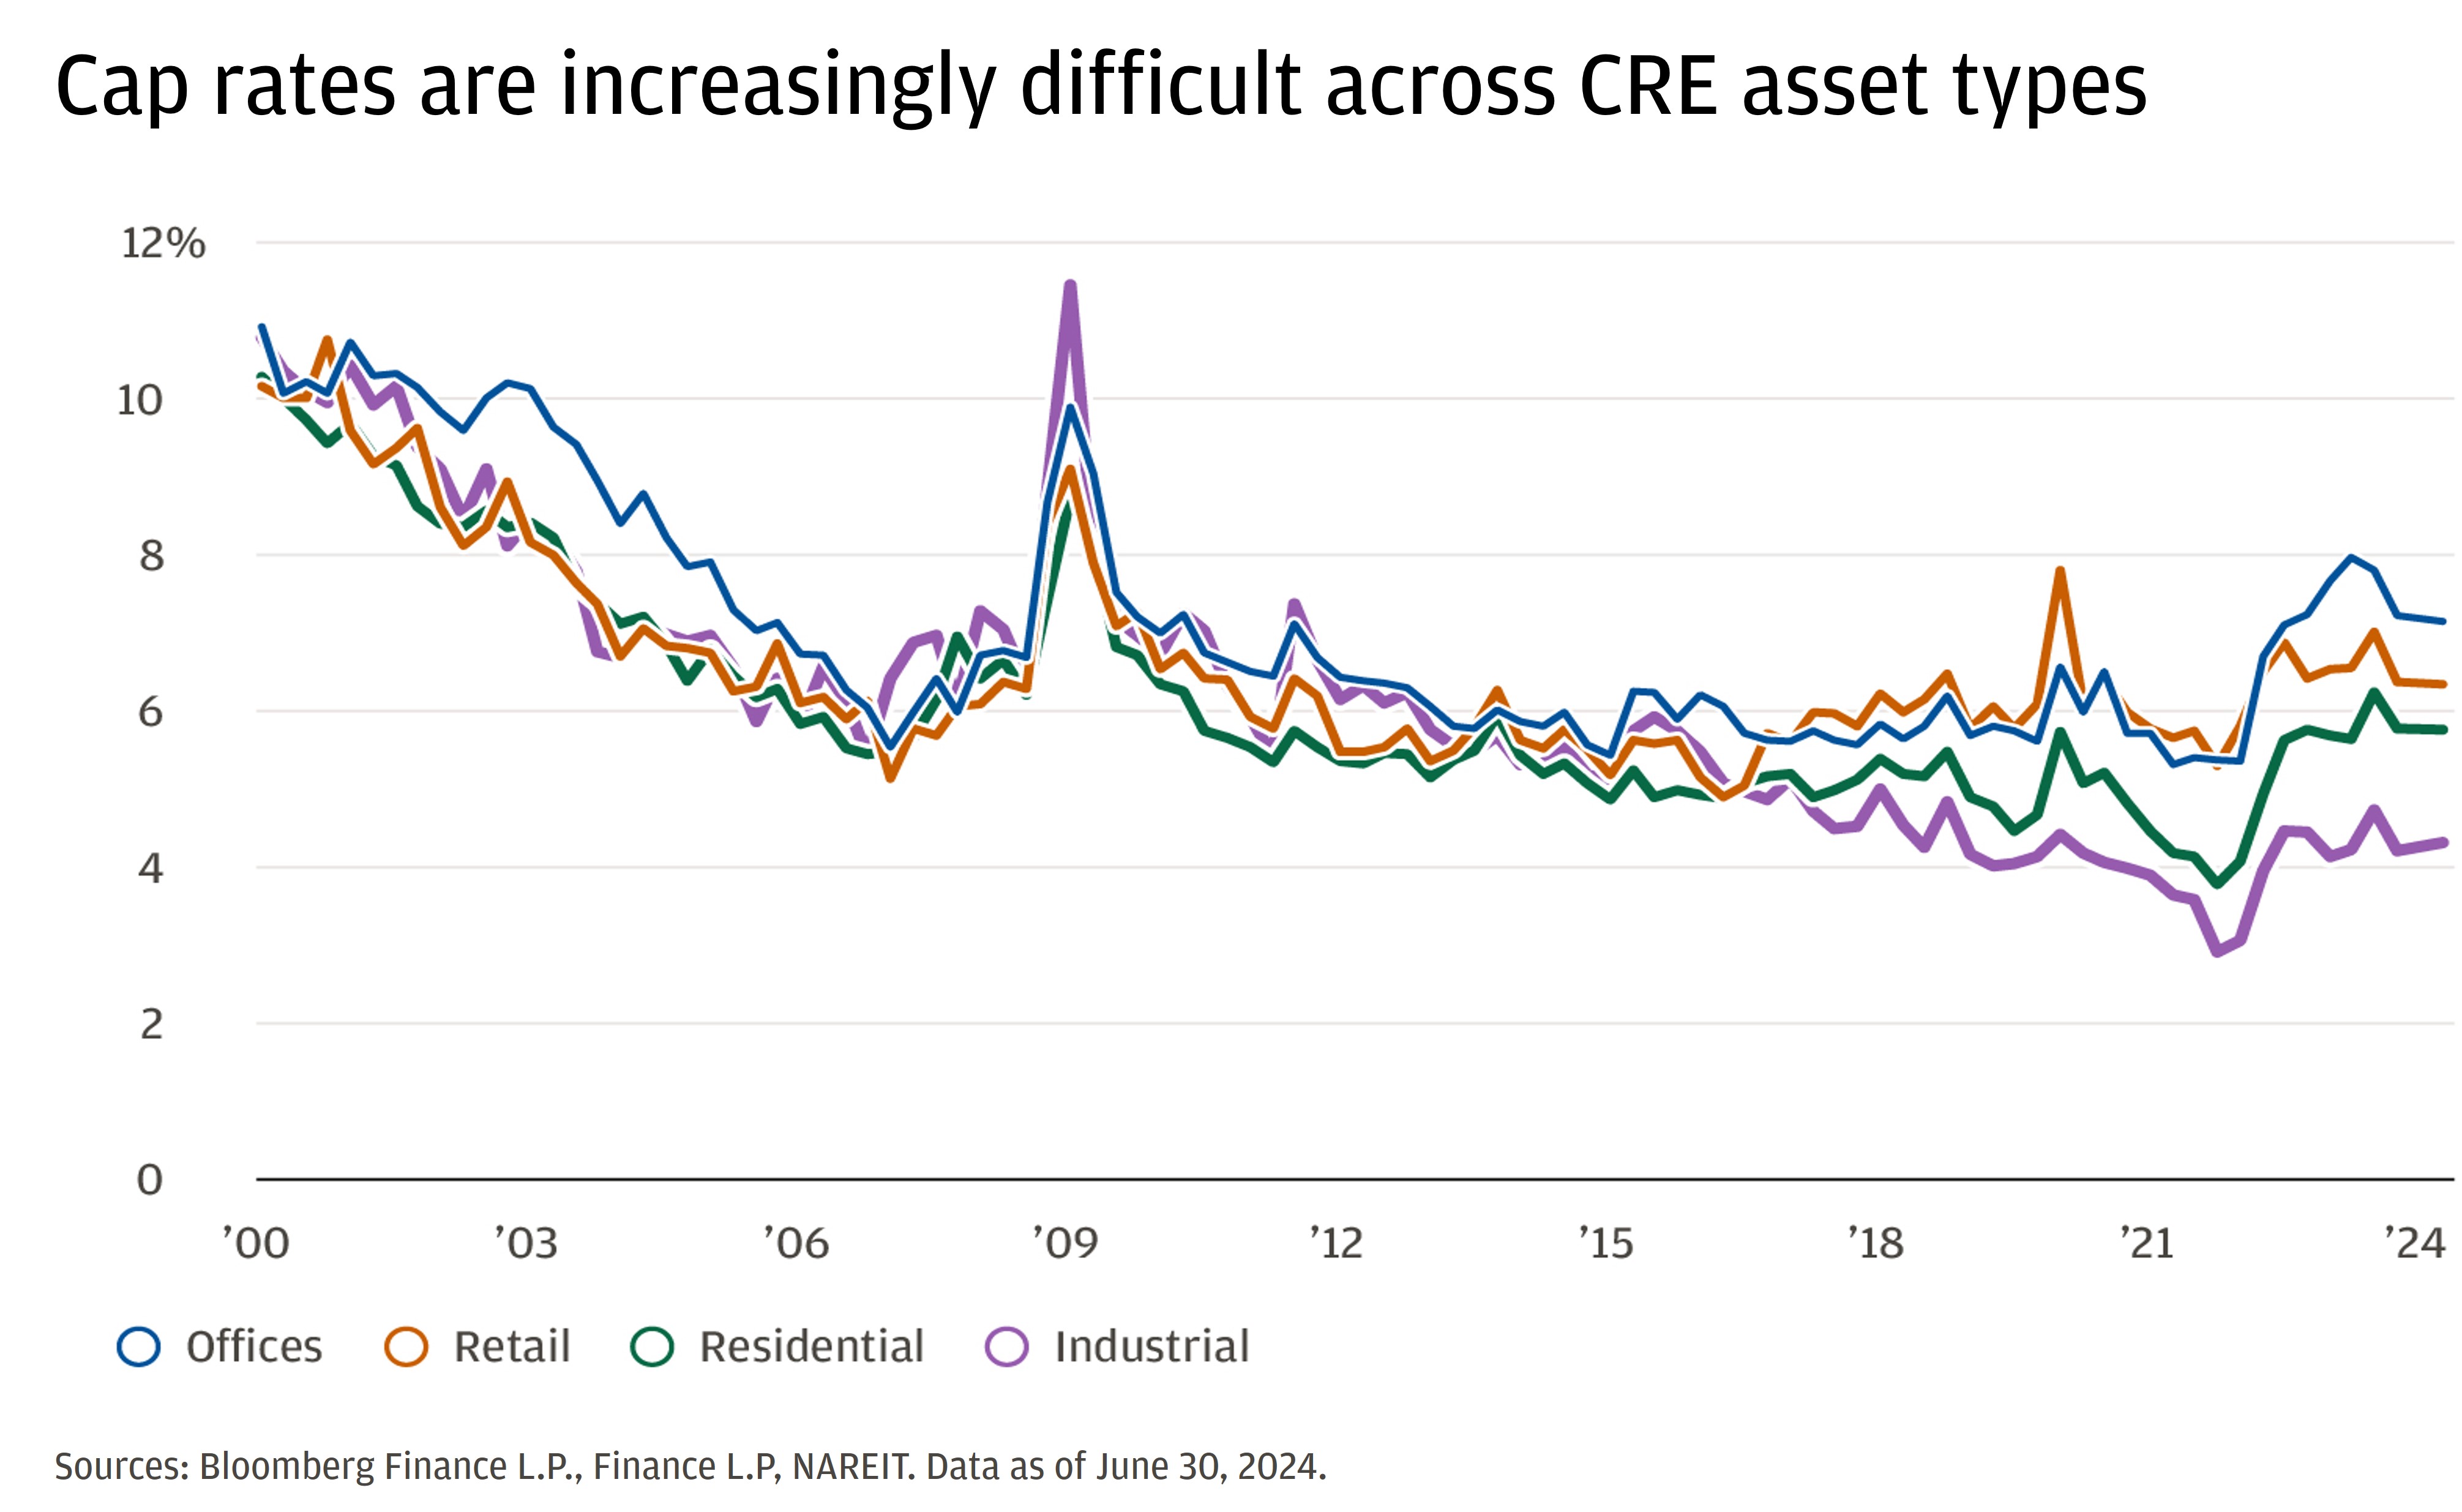
Different regions also tell different stories. For instance, office real estate in Southern New Jersey is thriving, while Seattle is taking a hit.
The quality of the asset matters, too. Despite office vacancies of around 18%, the One Vanderbilt office building in New York City is 99.4% leased and grew NOI by 150% in 2023.9 The market is all over the place, and that could be where the opportunities lie.
3. Non-listed REITs are no longer mismarked
One of the strongest narratives for the CRE market has held that investors should avoid investing in non-listed (private) real estate investment trusts (REITs).10 The popular belief has been that these investments’ net asset values (NAVs) do not fully reflect current market conditions. The narrative says that they’re overpriced, and as a result, they will begin to underperform their listed REIT counterparts, which have declined in price.11
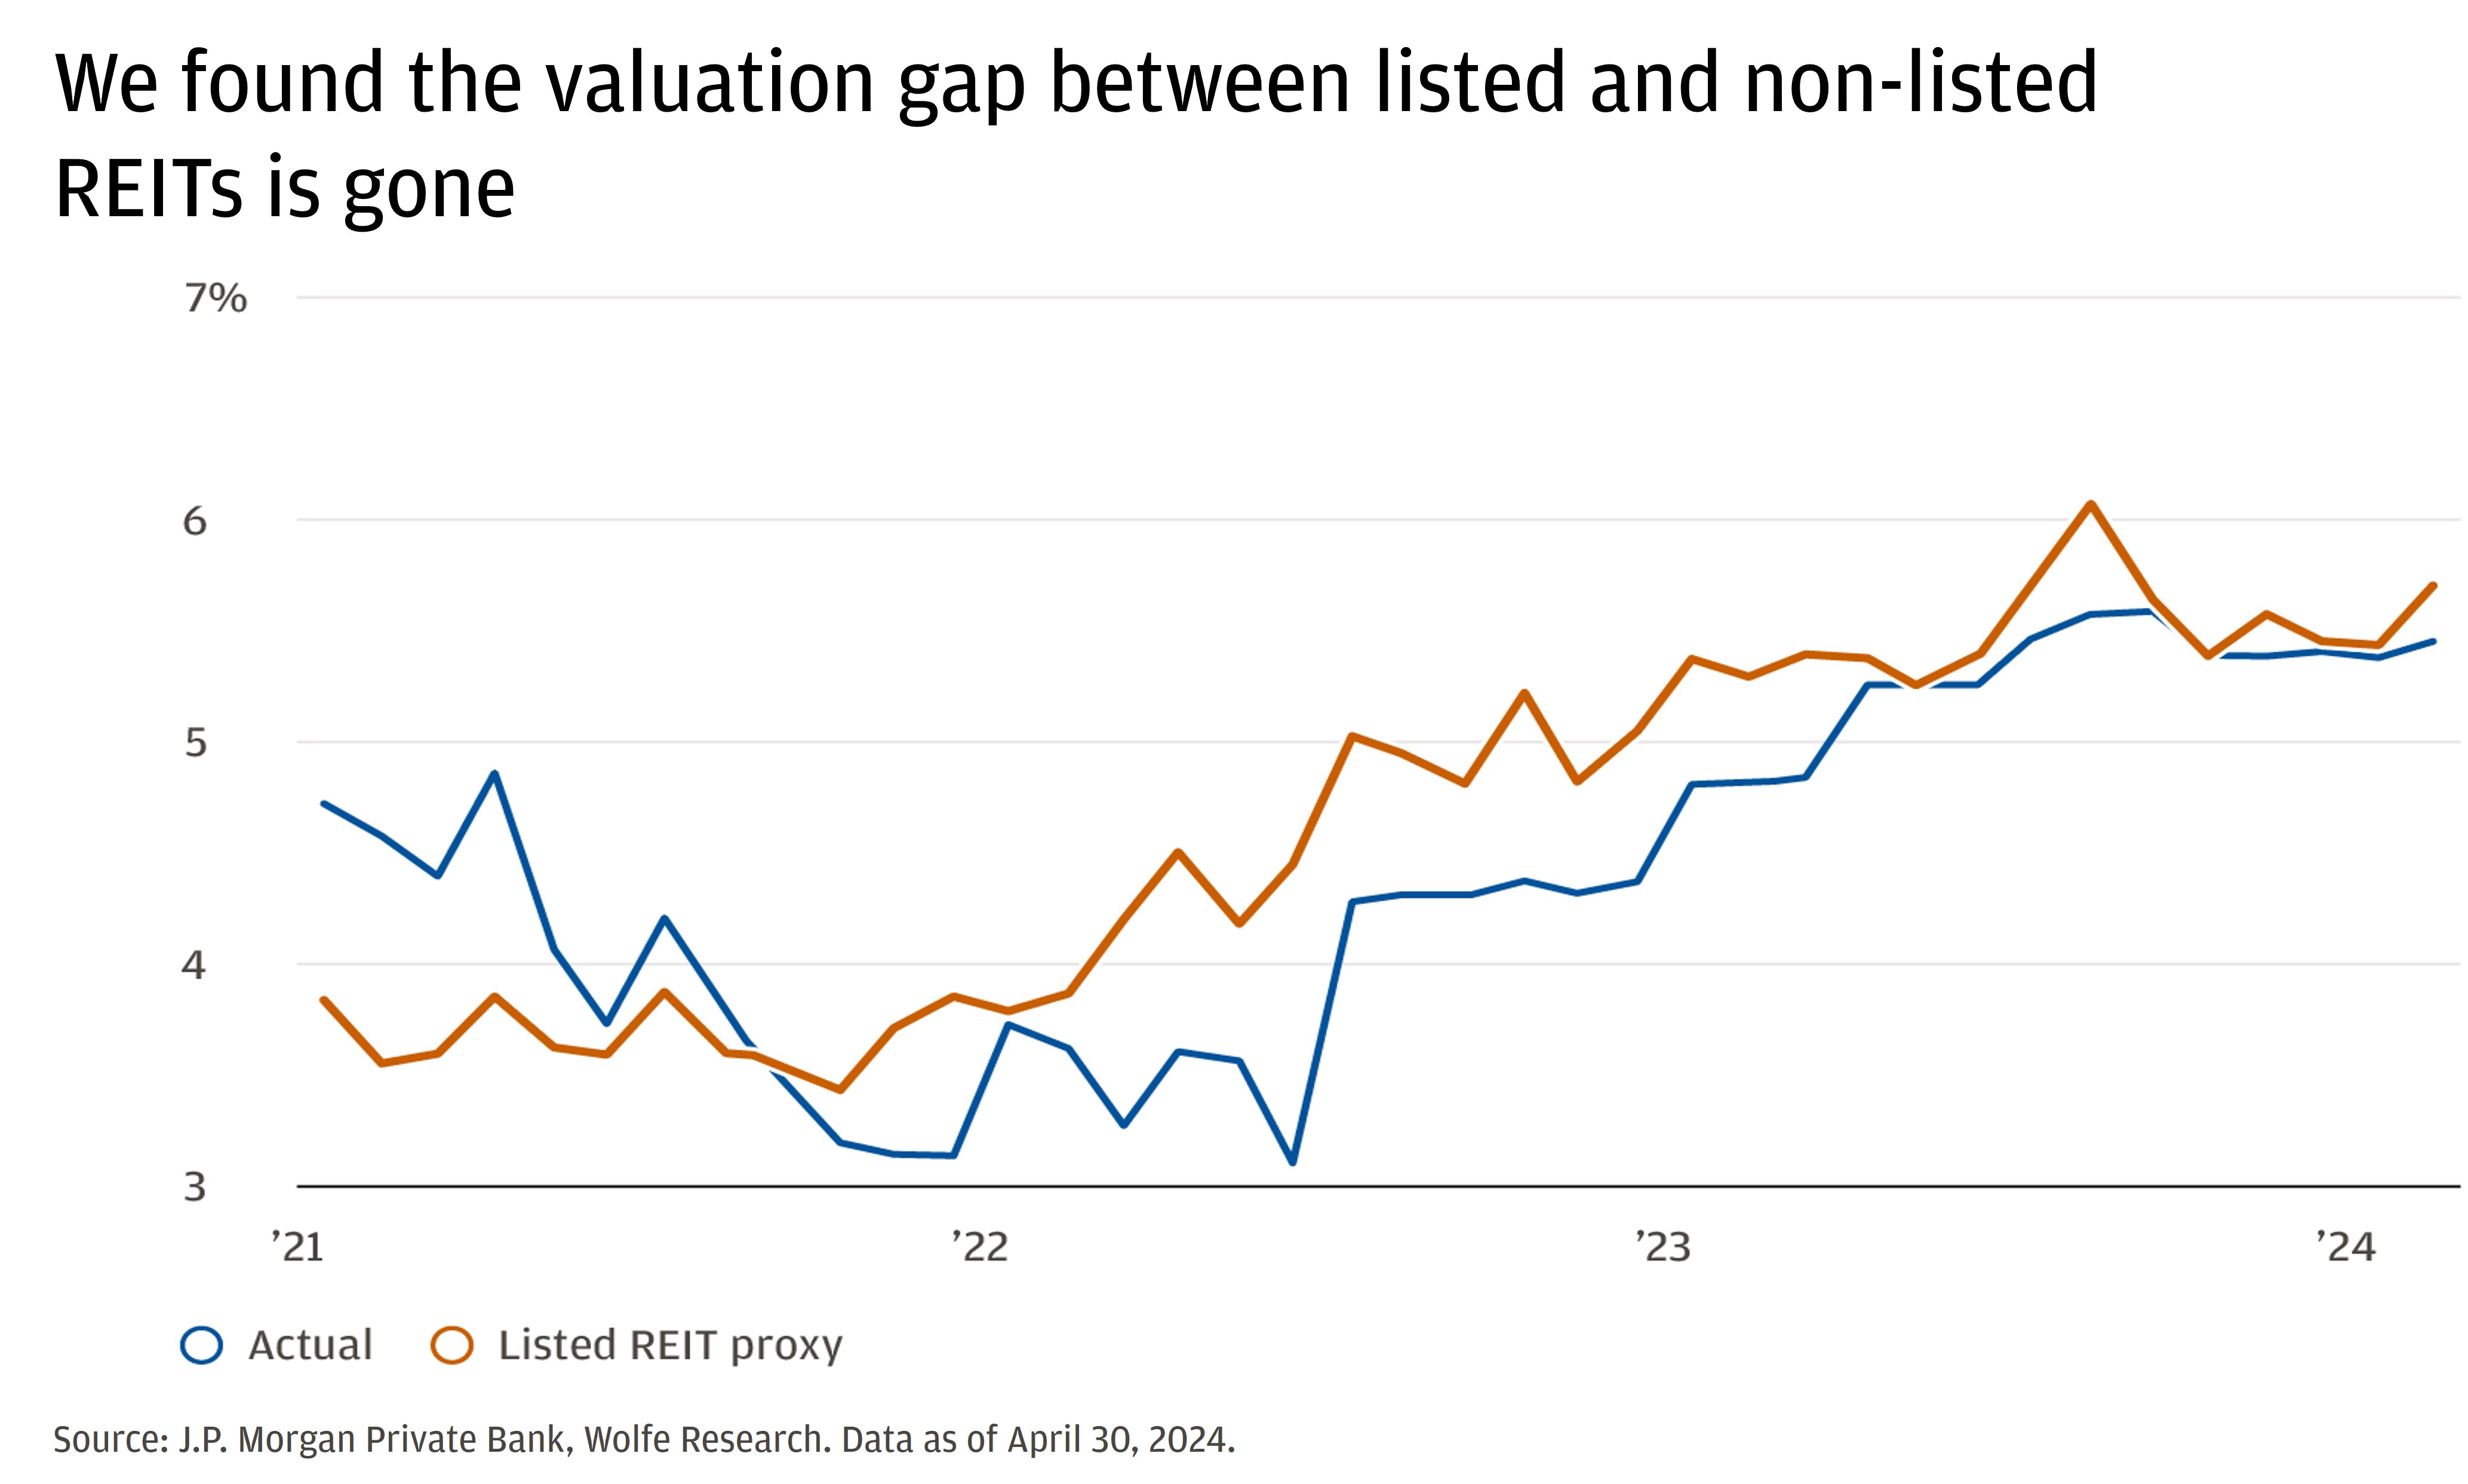
We disagree. At the moment, we see minimal to nonexistent valuation differences (measured by cap rates) between listed and non-listed REITs, despite their divergent performance.
We did a study to understand theoretically cap rate dispersion over time between a popular non-listed REIT and its listed equivalent REITs. If the non-listed REIT was mismarked, we would expect the actual cap rate to differ from the cap rate we simulated by using listed REIT proxies.
While the gap was wide in 2022 and parts of 2023 due to valuation adjustments by the non-listed REITs and strong relative performance by listed REITs, that gap has closed. Therefore, we think differences in total return between listed and non-listed REITs will be driven primarily by differences in the NOI growth of the assets owned.
This means it would make sense for interested investors to consider owning both.
Conclusion: Consider adding CRE exposure
We believe the recent sell-off may be complete, and that investors should consider adding CRE exposure. REIT values are driven by cash flows and multiples. We expect a soft landing in the U.S., meaning lower interest rates without a meaningful decline in growth. NOI growth is likely to remain resilient. Financing difficulties are expected to ease as interest rates fall, which should prevent further decreases in multiples (increasing cap rates) and stabilize property values.
We believe investors should consider adding both listed and non-listed CRE markets, as their transactional cap rates are similar. We emphasize that an investor’s decision to add exposure should be based on their liquidity needs, interest in and ability to use leverage and risk tolerance, not on valuation, as these look similar.
In CRE investing, REIT manager selection is critical. Since 1989, the average listed REIT manager in the top half has posted performance more than 35% better than an average manager in the bottom half.12 With a greater range of fundamentals and cap rates in properties of different types and in different regions, we believe manager alpha will be even more important this cycle.
Speak with your J.P. Morgan advisor to explore whether investing in commercial real estate makes sense for your portfolio and supports your long-term financial goals.
References
New York Post, “U.S. Office Prices Headed for ‘Severe Crash,” Investors Say.” (October 2023)
The Hill, “Wall Street Braces for Commercial Real Estate Time Bomb.” (March 2024)
New York Times, “’Zombie Offices’ Spell Trouble for Some Banks.” (February 2024)
This metric is called net operation income (NOI).
Twenty times multiple is derived by dividing one by NOI. In this case, 1/.04 = 20x.
Haver Analytics; Census Bureau. Data as of March 31, 2024.
Wells Fargo; CoStar Inc. Data as of March 31, 2024.
Implied cap rates from listed REITs.
J.P. Morgan Asset Management; Costar. Data as of December 31, 2023.
Real Estate Investment Trust. Non-listed REITs are not traded on an exchange, and they do not have daily liquidity like listed REITs.
Non-listed REIT proxy created through a weighted average cap rate of listed REITs with the same asset class exposures. Weights are based on % of rental income. Net operating income is from public filings.
Net asset value (NAV) is the total value of a REIT’s assets minus its liabilities, providing a snapshot of the REIT’s intrinsic value.
Connect with a Wealth Advisor
Our Wealth Advisors begin by getting to know you personally. To get started, tell us about your needs and we’ll reach out to you.
IMPORTANT INFORMATION
Real estate, hedge funds, and other private investments may not be suitable for all individual investors, may present significant risks, and may be sold or redeemed at more or less than the original amount invested. Private investments are offered only by offering memoranda, which more fully describe the possible risks. There are no assurances that the stated investment objectives of any investment product will be met. Hedge funds (or funds of hedge funds): often engage in leveraging and other speculative investment practices that may increase the risk of investment loss; can be highly illiquid; are not required to provide periodic pricing or valuation information to investors; may involve complex tax structures and delays in distributing important tax information; are not subject to the same regulatory requirements as mutual funds; and often charge high fees. Further, any number of conflicts of interest may exist in the context of the management and/or operation of any hedge fund.
This material is for informational purposes only, and may inform you of certain products and services offered by J.P. Morgan’s wealth management businesses, part of JPMorgan Chase & Co. (“JPM”). Products and services described, as well as associated fees, charges and interest rates, are subject to change in accordance with the applicable account agreements and may differ among geographic locations. Not all products and services are offered at all locations. If you are a person with a disability and need additional support accessing this material, please contact your J.P. Morgan team or email us at accessibility.support@jpmorgan.com for assistance. Please read all Important Information.
GENERAL RISKS & CONSIDERATIONS. Any views, strategies or products discussed in this material may not be appropriate for all individuals and are subject to risks. Investors may get back less than they invested, and past performance is not a reliable indicator of future results. Asset allocation/diversification does not guarantee a profit or protect against loss. Nothing in this material should be relied upon in isolation for the purpose of making an investment decision. You are urged to consider carefully whether the services, products, asset classes (e.g. equities, fixed income, alternative investments, commodities, etc.) or strategies discussed are suitable to your needs. You must also consider the objectives, risks, charges, and expenses associated with an investment service, product or strategy prior to making an investment decision. For this and more complete information, including discussion of your goals/situation, contact your J.P. Morgan representative.
NON-RELIANCE. Certain information contained in this material is believed to be reliable; however, JPM does not represent or warrant its accuracy, reliability or completeness, or accept any liability for any loss or damage (whether direct or indirect) arising out of the use of all or any part of this material. No representation or warranty should be made with regard to any computations, graphs, tables, diagrams or commentary in this material, which are provided for illustration/reference purposes only. The views, opinions, estimates and strategies expressed in this material constitute our judgment based on current market conditions and are subject to change without notice. JPM assumes no duty to update any information in this material in the event that such information changes. Views, opinions, estimates and strategies expressed herein may differ from those expressed by other areas of JPM, views expressed for other purposes or in other contexts, and this material should not be regarded as a research report. Any projected results and risks are based solely on hypothetical examples cited, and actual results and risks will vary depending on specific circumstances. Forward-looking statements should not be considered as guarantees or predictions of future events.
Nothing in this document shall be construed as giving rise to any duty of care owed to, or advisory relationship with, you or any third party. Nothing in this document shall be regarded as an offer, solicitation, recommendation or advice (whether financial, accounting, legal, tax or other) given by J.P. Morgan and/or its officers or employees, irrespective of whether or not such communication was given at your request. J.P. Morgan and its affiliates and employees do not provide tax, legal or accounting advice. You should consult your own tax, legal and accounting advisors before engaging in any financial transactions.
Legal Entity and Regulatory Information.
J.P. Morgan Wealth Management is a business of JPMorgan Chase & Co., which offers investment products and services through J.P. Morgan Securities LLC (JPMS), a registered broker-dealer and investment adviser, member FINRA and SIPC. Insurance products are made available through Chase Insurance Agency, Inc. (CIA), a licensed insurance agency, doing business as Chase Insurance Agency Services, Inc. in Florida. Certain custody and other services are provided by JPMorgan Chase Bank, N.A. (JPMCB). JPMS, CIA and JPMCB are affiliated companies under the common control of JPMorgan Chase & Co. Products not available in all states.
Bank deposit accounts and related services, such as checking, savings and bank lending, are offered by JPMorgan Chase Bank, N.A. Member FDIC.
This document may provide information about the brokerage and investment advisory services provided by J.P. Morgan Securities LLC (“JPMS”). The agreements entered into with JPMS, and corresponding disclosures provided with respect to the different products and services provided by JPMS (including our Form ADV disclosure brochure, if and when applicable), contain important information about the capacity in which we will be acting. You should read them all carefully. We encourage clients to speak to their JPMS representative regarding the nature of the products and services and to ask any questions they may have about the difference between brokerage and investment advisory services, including the obligation to disclose conflicts of interests and to act in the best interests of our clients.
J.P. Morgan may hold a position for itself or our other clients which may not be consistent with the information, opinions, estimates, investment strategies or views expressed in this document. JPMorgan Chase & Co. or its affiliates may hold a position or act as market maker in the financial instruments of any issuer discussed herein or act as an underwriter, placement agent, advisor or lender to such issuer.


