
Contributors

J.P. Morgan Wealth Management
Market Update
Rotation woes. Investors have spurned some of their favorite trades in favor of laggards for another week. The S&P 500 fell almost -2%, the Nasdaq 100 dropped -3.5%, and the “Magnificent 7” fell over -4.5%.
On the other hand, U.S. small caps popped another +2%, biotech spiked by over +5%, and the yen finally gained against the U.S. dollar.
Nvidia is now in its own bear market (down over -20% from its all-time high), but regional banks are finally higher than where they were when the U.S. mini banking crisis hit in March 2023.
Fixed income markets are feeling their own shift. Two-year yields have dropped by -8 basis points while the 10-year yield was flat. This kind of yield curve steepening (short-term yields moving down faster than long-term yields) is typical around the start of rate cutting cycles.
Indeed, yesterday’s first look at 2Q gross domestic product (GDP) showed the U.S. economy grew at a +2.8% annualized rate (faster than the 2% Street expectations). Growth is holding up, and inflation is no longer threatening. That should allow the Federal Reserve (Fed) to ease policy rates. Futures markets suggest a 100% chance of a September rate cut. That is as strong a signal as any that it is time to step out of excess cash.
Now, we would forgive you for not noticing the moves in markets. The U.S. election is already taking up most of the airtime after all. In this week’s spotlight, we examine the extent to which the moves we are seeing in markets are being driven by changing perceptions of the U.S. election outcome.
The “Trump trade”
Since 1950, there have been 18 presidential elections and 10 transitions in the White House between Democrats and Republicans. Over those 74 years, U.S. GDP growth has averaged a 3.2% annual pace, and the S&P 500 has compounded at 9.4% per year.
Despite the long-term trends, elections can introduce short-term volatility. Most of the focus this time has revolved around what a Trump/Vance victory might mean for markets given that the 2016 election caused notable moves across asset classes, and that most investors currently perceive Trump to be the favorite to win the White House.
What is the Trump trade? The Trump trade is a view that less regulation, lower taxes, less immigration and higher tariffs could benefit certain sectors and industries, and have important implications for inflation and bond yields.
What happened in 2016? An important piece of context for the 2016 election is that President Donald Trump’s victory was a surprise. It wouldn’t be this time. In 2016, investors quickly shook off initial fears that a protectionist agenda would hurt stocks, and instead embraced the prospect for corporate tax cuts and a focus on pro-growth policies like infrastructure investment.
The first “Trump trade” was most prominent in the month following the election. Before the 2016 election, the market was focused on sluggish growth, low inflation and low interest rates (aka “secular stagnation”). Trump’s policies were viewed as stimulative to nominal growth, and policymakers actually welcomed upward pressure on below-target inflation.
The first Trump trade was characterized by small caps (which outperformed large-cap equities by nearly 8%), the energy sector (which outperformed the broader index by over 10%), the 10-year Treasury bond (yields rose by almost 100 basis points) and the 2- and 10-year yield curves (which steepened by 17 basis points).
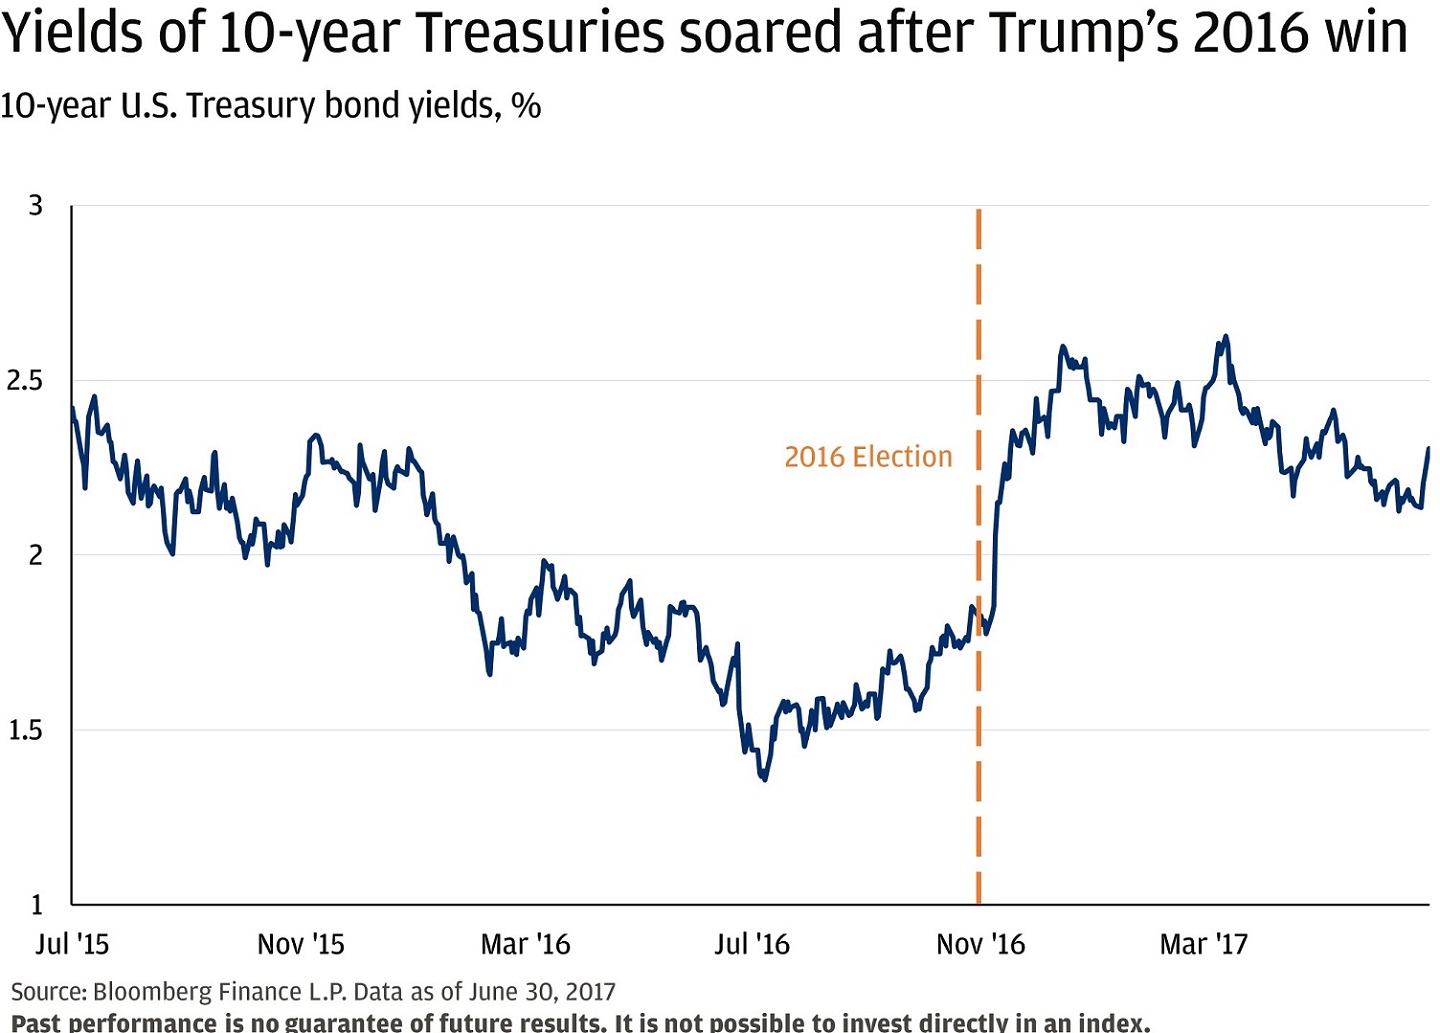
Yields of 10-year Treasuries soared after Trump’s 2016 win
10-year U.S. Treasury bond yields, percent
This chart shows yields of 10-year US treasury bonds from July 2015 to June 2017.
- In July 2015 the 10-year treasury yielded 2.4%. In November 2015 the 10-year treasury yielded 2.3%.
- In March 2016 the 10-year treasury yielded 1.8%. In July 2016 the 10-year treasury yielded 1.3%.
- In November 2016 the 10-year treasury yielded 1.7% before jumping to 2.6% in December 2016 after Donald Trump won the Presidential election.
- In March 2017 the 10-year treasury yielded 2.5%. In June 2017 the 10-year treasury yielded 2.3%.
Source: Bloomberg Finance L.P. Data as of June 30, 2017.
Past performance is no guarantee of future results. It is not possible to invest directly in an index.
How are markets responding to the prospect of Trump 2.0? According to Real Clear Politics, betting markets gave Trump a 47% chance to win the 2024 U.S. presidential election on May 31. That rose nearly 19 percentage points to a peak of 66% on July 15. Since President Joe Biden has dropped out of the race, Trump’s odds have fallen about 10 points to 56%. We look at the rise and fall of Trump's winning odds over those periods and how the Trump 1.0 trades fared this time around.
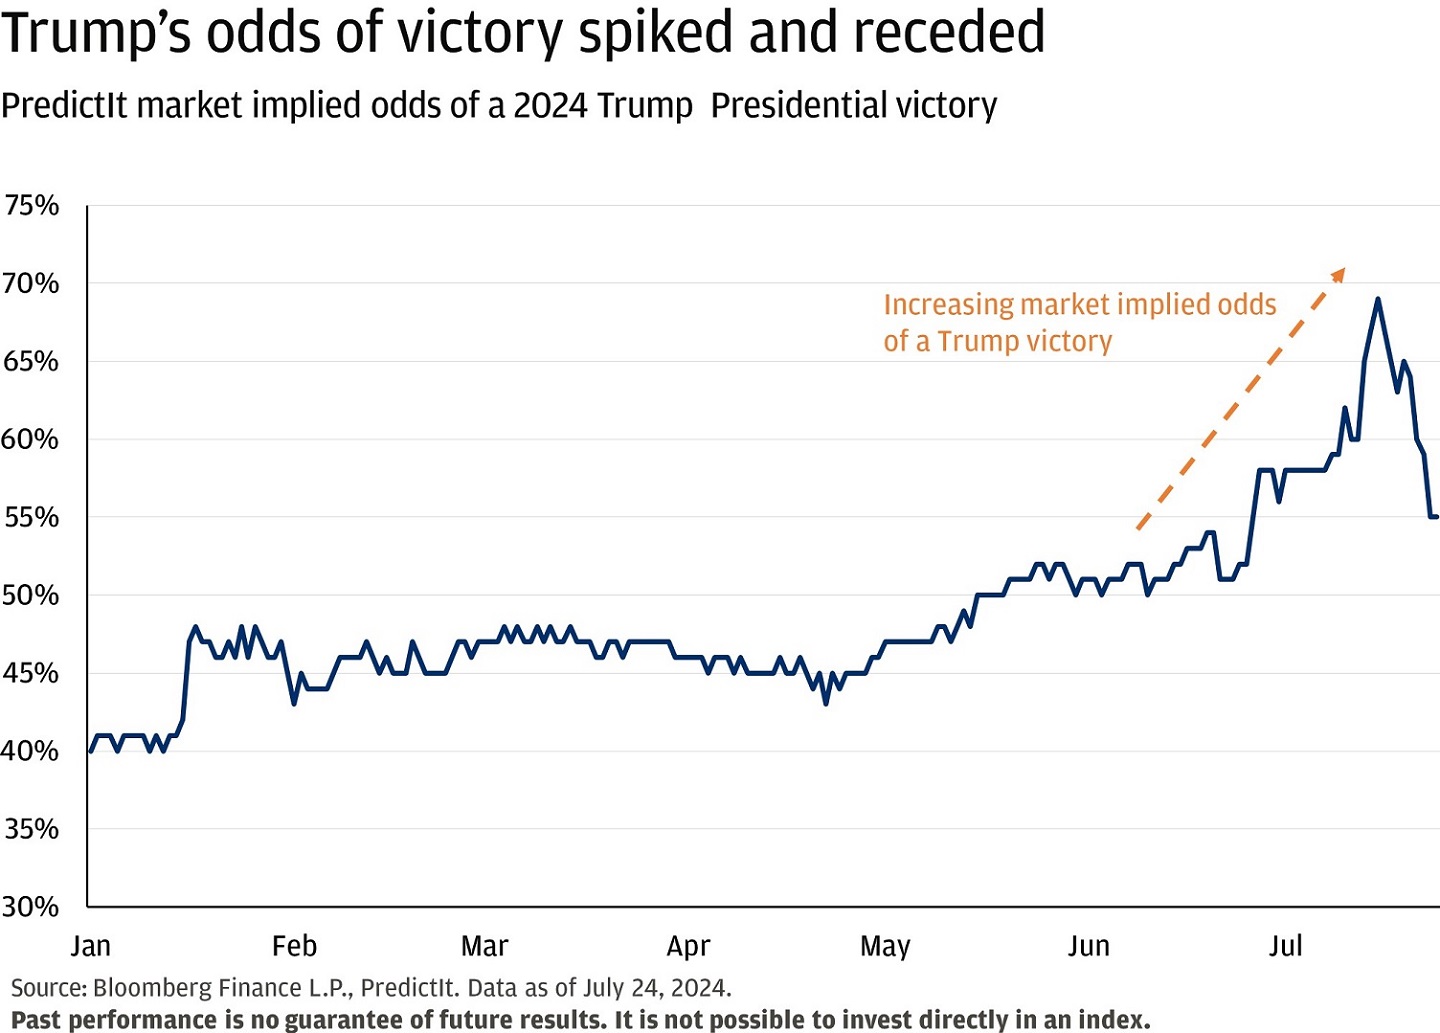
Trump’s odds of victory spiked and receded
PredictIt market implied odds of a 2024 Trump Presidential victory
This chart shows the betting odds for a Trump victory in the 2024 Presidential election from January 2024 to the present. PredictIt market implied odds of a 2024 Trump Presidential victory. In January, the odds were at 40%. By May, they had risen to 50% after a long period of plateauing. They rose throughout June to end the month at 56%. The odds spiked in July, reaching a high of 69% before falling to their present value of 55%.
Source: Bloomberg Finance L.P., PredictIt. Data as of July 24, 2024.
Past performance is no guarantee of future results. It is not possible to invest directly in an index.
- Small caps: Small-cap stocks rose by 4.6% as Trump’s odds were improving, mirroring the “1.0” trade. However, over the same period, large caps returned 6.7%. Interestingly, small caps have started to outperform large caps despite the decline in Trump’s odds. This suggests that there is more to small-cap outperformance than just the election. Interest rates and valuations are more likely the drivers of small-cap returns. As our Asset & Wealth Management Chairman of Investment Strategy Michael Cembalest noted in his latest piece, more than 40% of the small-cap index is unprofitable. That makes them reliant on debt capital markets for financing. Therefore, the prospect of lower interest rates has a large impact on small caps. Small caps have benefitted from the view that inflation has finally turned the corner and that the Fed will start cutting rates in September.
- Energy: The energy sector rallied in 2016 based on optimism around less onerous regulations and more independent U.S. energy production. Eight years later, the U.S. is now the world’s dominant oil producer. While less regulation could bring even more production, an oil glut could put downward pressure on prices and negatively impact energy company earnings. This time around, the energy sector declined while Trump’s odds were increasing.
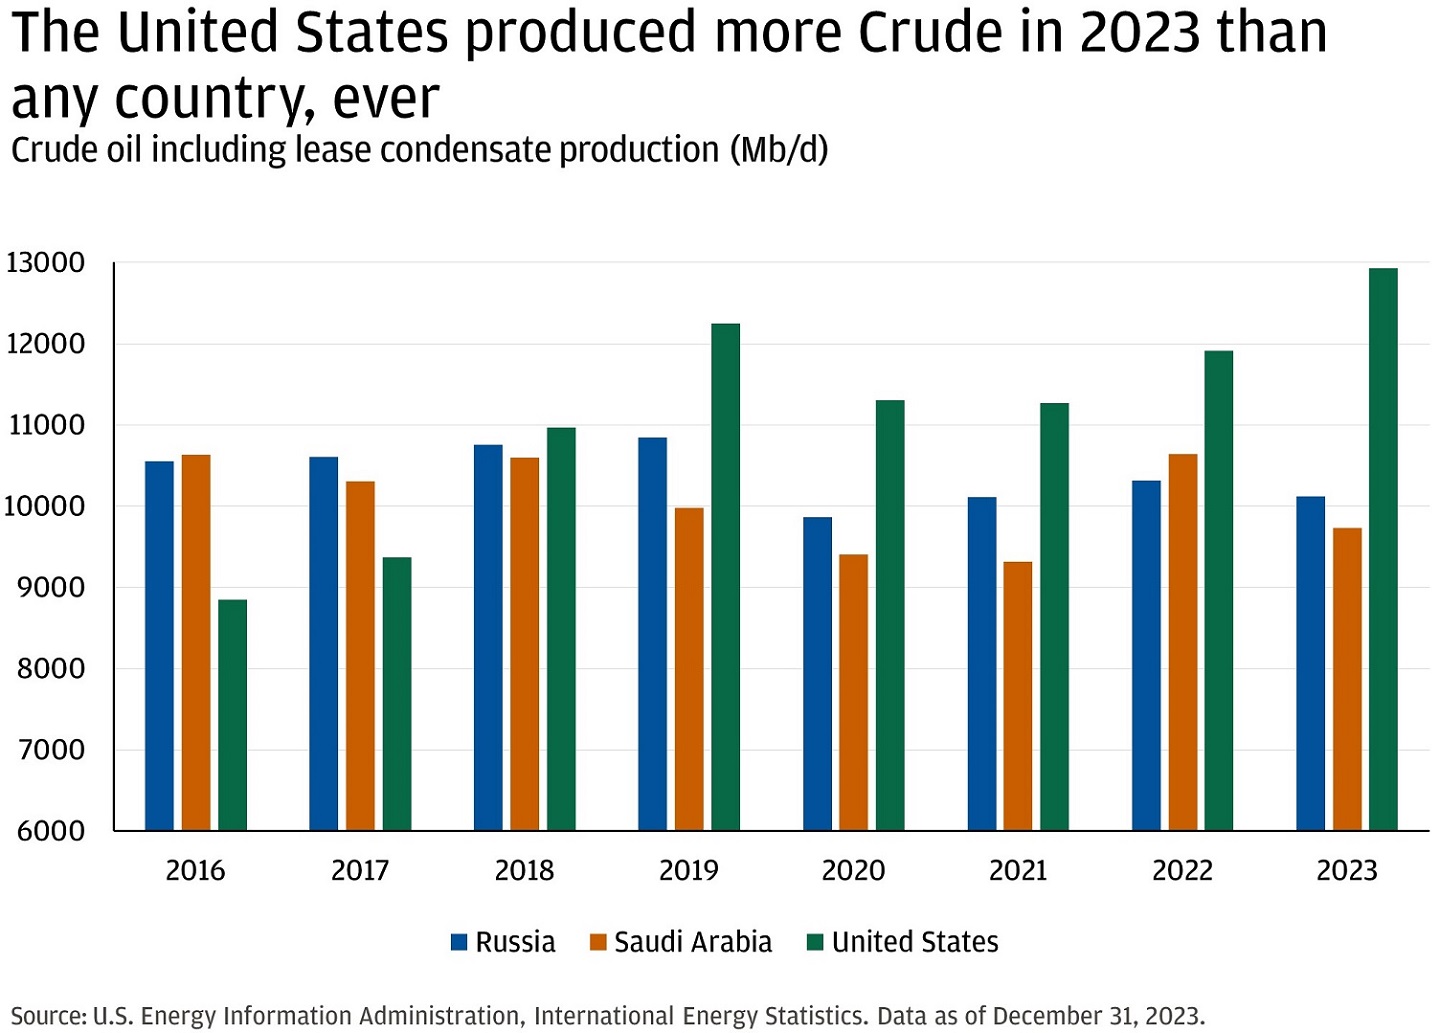
The United States produced more Crude in 2023 than any country, ever
Crude oil including lease condensate production (Mb/d)
This chart shows the average daily production of Crude oil of Russia, Saudia Arabia, and the United States from 2016 to 2023.
- In 2016, Russia produced 10551.4972677595 million barrels per day of crude oil.
- In 2016, Saudi Arabia produced 10634.7103825136 million barrels per day of crude oil.
- In 2016, the United States produced 8851.51905191256 million barrels per day of crude oil.
- In 2017, Russia produced 10605.0493155024 million barrels per day of crude oil.
- In 2017, Saudi Arabia produced 10305.4246575342 million barrels per day of crude oil.
- In 2017, the United States produced 9371.35610410958 million barrels per day of crude oil.
- In 2018, Russia produced 10758.554834889 million barrels per day of crude oil.
- In 2018, Saudi Arabia produced 10598.1369863013 million barrels per day of crude oil.
- In 2018, the United States produced 10964.0878684931 million barrels per day of crude oil.
- In 2019, Russia produced 10847.3741518755 million barrels per day of crude oil.
- In 2019, Saudi Arabia produced 9980.90410958904 million barrels per day of crude oil.
- In 2019, the United States produced 12248.0191452054 million barrels per day of crude oil.
- In 2020, Russia produced 9865.4217201948 million barrels per day of crude oil.
- In 2020, Saudi Arabia produced 9405.66666666666 million barrels per day of crude oil.
- In 2020, the United States produced 11307.5628469945 million barrels per day of crude oil.
- In 2021, Russia produced 10111.8279307793 million barrels per day of crude oil.
- In 2021, Saudi Arabia produced 9313.14470734749 million barrels per day of crude oil.
- In 2021, the United States produced 11267.7285424657 million barrels per day of crude oil.
- In 2022, Russia produced 10314.4699527361 million barrels per day of crude oil.
- In 2022, Saudi Arabia produced 10644.3938173029 million barrels per day of crude oil.
- In 2022, the United States produced 11910.6223013698 million barrels per day of crude oil.
- In 2023, Russia produced 10123.979549667 million barrels per day of crude oil.
- In 2023, Saudi Arabia produced 9733.47945205479 million barrels per day of crude oil.
- In 2023, the United States produced 12927.2169424657 million barrels per day of crude oil.
Source: U.S. Energy Information Administration, International Energy Statistics. Data as of December 31, 2023.
- Bond yields: This time, bond yields across the curve have declined since Trump’s odds have increased, but the yield curve has steepened. Said differently, shorter term interest rates are moving lower, faster than longer term interest rates. To us, that suggests that central bank policy expectations are the primary driver of bond yields, and not the election. This is perhaps the biggest difference between 2016 and today. Then, the central bank was desperate for any signs of inflation that would allow them to raise rates above nearly 0%. Today, the central bank is desperate for confirmation that inflation is low enough to allow them to lower rates from 20-year highs. The key risk for bond markets is that protectionist economic policy like increased tariffs and less immigration will reduce growth and increase inflation at the same time that the extension of tax cuts will increase the deficit. The good news right now is that it seems like bond yields are taking their cues from the growth, inflation and central bank policy outlook.
Overall the Trump Trade 2.0 seems relatively inconclusive. Instead, it seems like markets are reacting more to the increasing likelihood that the Fed will be lowering interest rates with a backdrop of relatively decent underlying economic growth. However, certain sectors and industries may be more sensitive to changing election perceptions. Regional banks, for example, have reacted positively to an increase in Trump’s odds. Meanwhile, clean energy and Chinese stocks have been negatively impacted. The bottom line for investors is that we believe the growth, inflation and policy backdrop will be the primary drivers of market moves, but the election will matter underneath the surface.
What does history have to say about election years?
Election years tend to bring similar levels of equity market volatility until October, when there is a noticeable uptick in the Volatility Index (VIX). But, since 1984 there has only been one election year where the market was lower 12 months after the election: that was in 2000 amid the tech bubble. Notably, implied equity market volatility falls relatively quickly after the new composition of government is confirmed and on average equities are higher 12 months after the election.
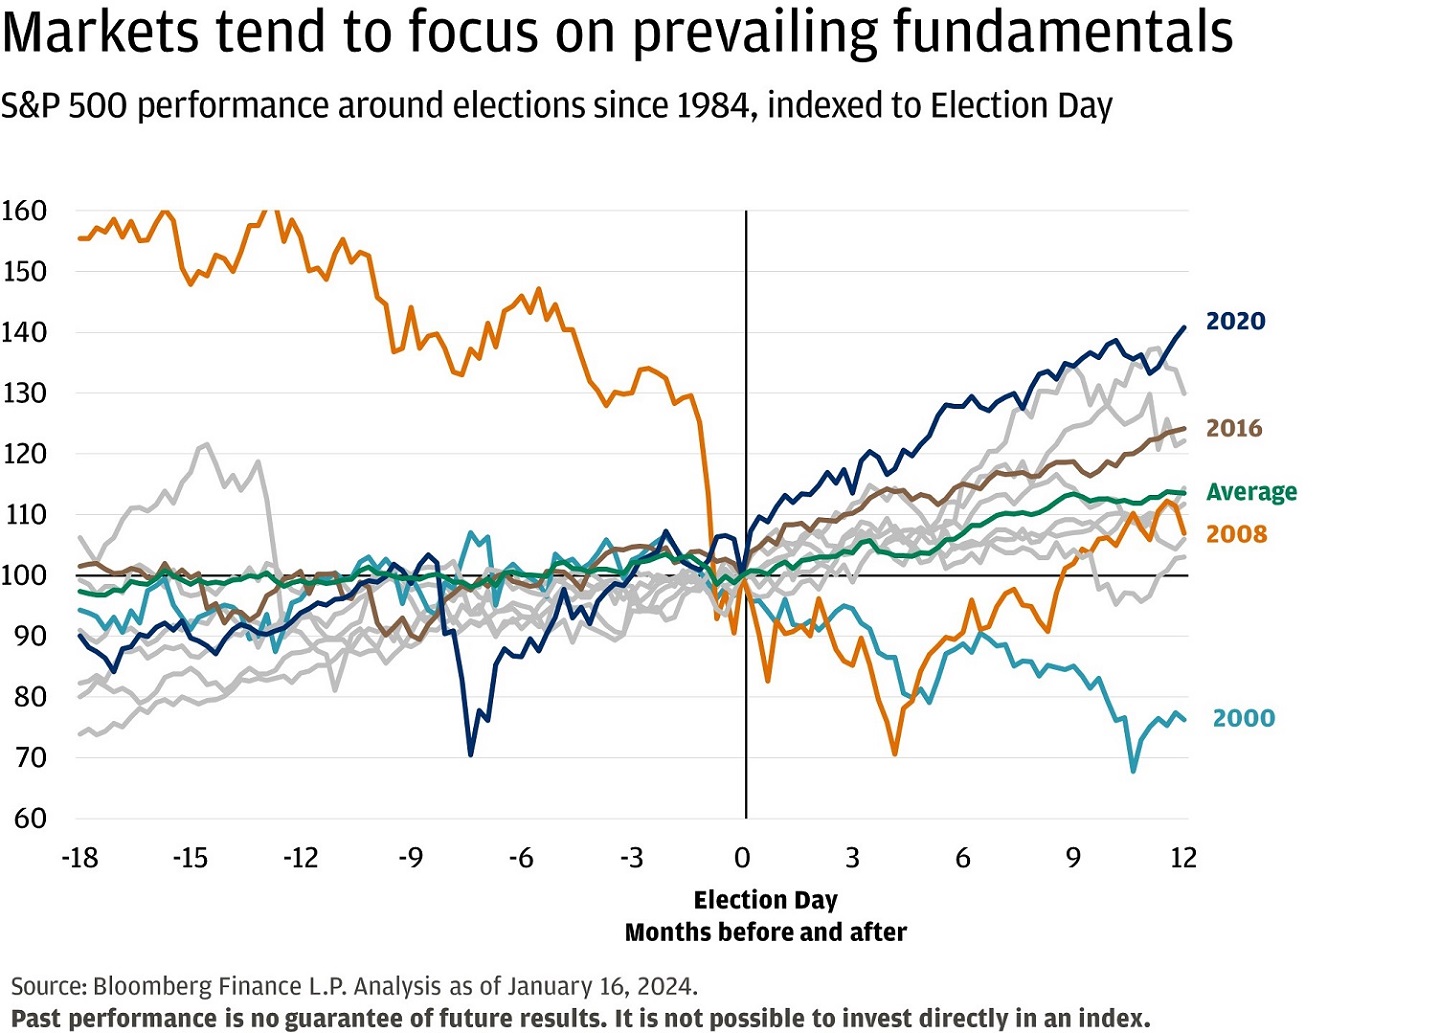
Markets tend to focus on prevailing fundamentals
S&P 500 performance around elections since 1984, indexed to Election Day
This chart shows the performance of the S&P 500 in the 18 months before and 12 months after US Presidential elections from 1984 to 2020. The performance is indexed to election day. On average, the S&P 500 rises 2.62% in the 18 months leading up to a presidential election and 13.55% in the 12 months afterwards.
- In 1984, the S&P 500 rose 0.79% in the 18 months leading up to a presidential election and 14.40% in the 12 months afterwards.
- In 1988, the S&P 500 fell 6.17% in the 18 months leading up to a presidential election and rose 22.19% in the 12 months afterwards.
- In 1992, the S&P 500 rose 9.05% in the 18 months leading up to a presidential election and 20.79% in the 12 months afterwards.
- In 1996, the S&P 500 rose 26.10% in the 18 months leading up to a presidential election and 29.96% in the 12 months afterwards.
- In 2000, the S&P 500 rose 5.73% in the 18 months leading up to a presidential election and fell 23.80% in the 12 months afterwards.
- In 2004, the S&P 500 rose 17.71% in the 18 months leading up to a presidential election and 6.04% in the 12 months afterwards.
- In 2008, the S&P 500 fell 55.42% in the 18 months leading up to a presidential election and rose 6.96% in the 12 months afterwards.
- In 2012, the S&P 500 rose 20.00% in the 18 months leading up to a presidential election and 3.04% in the 12 months afterwards.
- In 2016, the S&P 500 fell 1.48% in the 18 months leading up to a presidential election and rose 24.11% in the 12 months afterwards.
- In 2020, the S&P 500 rose 9.92% in the 18 months leading up to a presidential election and 40.84% in the 12 months afterwards.
Source: Bloomberg Finance L.P. Analysis as of January 16, 2024.
Past performance is no guarantee of future results. It is not possible to invest directly in an index.
As always, reach out to your J.P. Morgan advisor, who is here to help.
The market update data is as of 07/25/24 and the analysis for the spotlight section is as of 07/24/24 and are sourced from Bloomberg Finance L.P. and FactSet unless otherwise stated.
Connect with a Wealth Advisor
Our Wealth Advisors begin by getting to know you personally. To get started, tell us about your needs and we’ll reach out to you.
DISCLOSURES
The Chicago Board Option Exchange(CBOE) Volatility Index (VIX), is a real-time index that represents the market’s expectations for the relative strength of near-term price changes of the S&P 500 Index.
The Solactive United States 2000 Index intends to track the performance of the largest 1001 to 3000 companies from the United States stock market. Constituents are selected based on company market capitalization and weighted by free float market capitalization.
The iShares Russell 2000 ETF seeks to track the investment results of an index composed of small-capitalization U.S. equities.
The information presented is not intended to be making value judgments on the preferred outcome of any government decision or political election.
Investing in equities involves risk. The price of equity securities may rise or fall due to the changes in the broad market or changes in a company's financial condition, sometimes rapidly or unpredictably. Equity securities are subject to "stock market risk" meaning that stock prices in general may decline over short or extended periods of time.
Given the complex risk-reward trade-offs involved, we advise clients to rely on judgment as well as quantitative optimization approaches in setting strategic allocations. Please note that all information shown is based on qualitative analysis. Exclusive reliance on the above is not advised. This information is not intended as a recommendation to invest in any particular asset class or strategy or as a promise of future performance. Note that these asset class and strategy assumptions are passive only – they do not consider the impact of active management. References to future returns are not promises or even estimates of actual returns a client portfolio may achieve. Assumptions, opinions and estimates are provided for illustrative purposes only.
They should not be relied upon as recommendations to buy or sell securities. Forecasts of financial market trends that are based on current market conditions constitute our judgment and are subject to change without notice. We believe the information provided here is reliable, but do not warrant its accuracy or completeness. This material has been prepared for information purposes only and is not intended to provide, and should not be relied on for, accounting, legal or tax advice. The outputs of the assumptions are provided for illustration/discussion purposes only and are subject to significant limitations.
“Expected” or “alpha” return estimates are subject to uncertainty and error. For example, changes in the historical data from which it is estimated will result in different implications for asset class returns. Expected returns for each asset class are conditional on an economic scenario; actual returns in the event the scenario comes to pass could be higher or lower, as they have been in the past, so an investor should not expect to achieve returns similar to the outputs shown herein. References to future returns for either asset allocation strategies or asset classes are not promises of actual returns a client portfolio may achieve. Because of the inherent limitations of all models, potential investors should not rely exclusively on the model when making a decision. The model cannot account for the impact that economic, market, and other factors may have on the implementation and ongoing management of an actual investment portfolio. Unlike actual portfolio outcomes, the model outcomes do not reflect actual trading, liquidity constraints, fees, expenses, taxes and other factors that could impact the future returns. The model assumptions are passive only – they do not consider the impact of active management. A manager’s ability to achieve similar outcomes is subject to risk factors over which the manager may have no or limited control.
The views contained herein are not to be taken as advice or a recommendation to buy or sell any investment in any jurisdiction, nor is it a commitment from J.P. Morgan Asset Management or any of its subsidiaries to participate in any of the transactions mentioned herein. Any forecasts, figures, opinions or investment techniques and strategies set out are for information purposes only, based on certain assumptions and current market conditions and are subject to change without prior notice. All information presented herein is considered to be accurate at the time of production. This material does not contain sufficient information to support an investment decision and it should not be relied upon by you in evaluating the merits of investing in any securities or products. In addition, users should make an independent assessment of the legal, regulatory, tax, credit and accounting implications and determine, together with their own financial professional, if any investment mentioned herein is believed to be appropriate to their personal goals. Investors should ensure that they obtain all available relevant information before making any investment. It should be noted that investment involves risks, the value of investments and the income from them may fluctuate in accordance with market conditions and taxation agreements and investors may not get back the full amount invested. Both past performance and yield are not a reliable indicator of current and future results.
Index definitions:
The Russell 3000 Index is a capitalization-weighted stock market index that seeks to be a benchmark of the entire U.S. stock market. It measures the performance of the largest 3,000 U.S. companies representing approximately 96% of the investable U.S. equity market.
The S&P 500 Equal Weight Index is the equal-weight version of the widely-used S&P 500. The index includes the same constituents as the capitalization weighted S&P 500, but each company in the S&P 500 EWI is allocated a fixed weight of the index total at each quarterly rebalance.
The Bloomberg U.S. Aggregate Bond Index is a broad-based flagship benchmark that measures the investment grade, US dollar-denominated, fixed-rate taxable bond market. The index includes Treasuries, government-related and corporate securities, MBS (agency fixed-rate pass-throughs), ABS and CMBS (agency and non-agency).
The S&P 500 Equal Weighted Index is the equal-weight version of the widely-used S&P 500. The index includes the same constituents as the capitalization weighted S&P 500, but each company in the S&P 500 EWI is allocated a fixed weight – or 0.2% of the index total at each quarterly rebalance.
The Magnificent Seven stocks are a group of influential companies in the U.S. stock market: Alphabet, Amazon, Apple, Meta Platforms, Microsoft, NVIDIA, and Tesla.
The Magnificent 7 Index is an equal-dollar weighted equity benchmark consisting of a fixed basket of 7 widely-traded companies (Microsoft, Apple, Nvidia, Alphabet, Amazon, Meta, Tesla) classified in the United States and representing the Communications, Consumer Discretionary and Technology sectors as defined by Bloomberg Industry Classification System (BICS).
The S&P Midcap 400 Index is a capitalization-weighted index which measures the performance of the mid-range sector of the U.S. stock market.
The S&P 500 index is widely regarded as the best single gauge of large-cap U.S. equities and serves as the foundation for a wide range of investment products. The index includes 500 leading companies and captures approximately 80% coverage of available market capitalization.
Bonds are subject to interest rate risk, credit, call, liquidity and default risk of the issuer. Bond prices generally fall when interest rates rise.
The price of equity securities may rise or fall due to the changes in the broad market or changes in a company's financial condition, sometimes rapidly or unpredictably. Equity securities are subject to "stock market risk" meaning that stock prices in general may decline over short or extended periods of time.
Standard and Poor’s 500 Index is a capitalization-weighted index of 500 stocks. The index is designed to measure performance of the broad domestic economy through changes in the aggregate market value of 500 stocks representing all major industries. The index was developed with a base level of 10 for the 1941–43 base period.
The Bloomberg Eco Surprise Index shows the degree to which economic analysts under- or over-estimate the trends in the business cycle. The surprise element is defined as the percentage difference between analyst forecasts and the published value of economic data releases.
The MSCI World Index is a free float-adjusted market capitalization index that is designed to measure global developed market equity performance.
The NASDAQ 100 Index is a basket of the 100 largest, most actively traded U.S companies listed on the NASDAQ stock exchange. The index includes companies from various industries except for the financial industry, like commercial and investment banks. These non-financial sectors include retail, biotechnology, industrial, technology, health care, and others.
The Russell 2000 Index measures small company stock market performance. The index does not include fees or expenses.
We believe the information contained in this material to be reliable but do not warrant its accuracy or completeness. Opinions, estimates, and investment strategies and views expressed in this document constitute our judgment based on current market conditions and are subject to change without notice.
The views, opinions, estimates and strategies expressed herein constitutes the author's judgment based on current market conditions and are subject to change without notice, and may differ from those expressed by other areas of J.P. Morgan. This information in no way constitutes J.P. Morgan Research and should not be treated as such. You should carefully consider your needs and objectives before making any decisions. For additional guidance on how this information should be applied to your situation, you should consult your advisor.
All companies referenced are shown for illustrative purposes only, and are not intended as a recommendation or endorsement by J.P. Morgan in this context.
JPMorgan Chase & Co., its affiliates, and employees do not provide tax, legal or accounting advice. Information presented on these webpages is not intended to provide, and should not be relied on for tax, legal and accounting advice. You should consult your own tax, legal and accounting advisors before engaging in any financial transaction.
RISK CONSIDERATIONS
- Past performance is not indicative of future results. You may not invest directly in an index.
- The price of equity securities may rise or fall due to the changes in the broad market or changes in a company's financial condition, sometimes rapidly or unpredictably. Equity securities are subject to 'stock market risk' meaning that stock prices in general may decline over short or extended periods of time.
- Investing in fixed income products is subject to certain risks, including interest rate, credit, inflation, call, prepayment and reinvestment risk. Any fixed income security sold or redeemed prior to maturity may be subject to substantial gain or loss.
- In general, the bond market is volatile and bond prices rise when interest rates fall and vice versa. Longer term securities are more prone to price fluctuation than shorter term securities. Any fixed income security sold or redeemed prior to maturity may be subject to substantial gain or loss. Dependable income is subject to the credit risk of the issuer of the bond. If an issuer defaults no future income payments will be made.
- When investing in mutual funds or exchange-traded and index funds, please consider the investment objectives, risks, charges, and expenses associated with the funds before investing. You may obtain a fund’s prospectus by contacting your investment professional. The prospectus contains information, which should be carefully read before investing.
- Investors should understand the potential tax liabilities surrounding a municipal bond purchase. Certain municipal bonds are federally taxed if the holder is subject to alternative minimum tax. Capital gains, if any, are federally taxable. The investor should note that the income from tax-free municipal bond funds may be subject to state and local taxation and the alternative minimum tax (amt).
- International investments may not be suitable for all investors. International investing involves a greater degree of risk and increased volatility. Changes in currency exchange rates and differences in accounting and taxation policies outside the u.s. can raise or lower returns. Some overseas markets may not be as politically and economically stable as the united states and other nations. Investments in international markets can be more volatile.
- Investments in emerging markets may not be suitable for all investors. Emerging markets involve a greater degree of risk and increased volatility. Changes in currency exchange rates and differences in accounting and taxation policies outside the u.s. can raise or lower returns. Some overseas markets may not be as politically and economically stable as the united states and other nations. Investments in emerging markets can be more volatile.
- Investments in commodities may have greater volatility than investments in traditional securities, particularly if the instruments involve leverage. The value of commodity-linked derivative instruments may be affected by changes in overall market movements, commodity index volatility, changes in interest rates, or factors affecting a particular industry or commodity, such as drought, floods, weather, livestock disease, embargoes, tariffs and international economic, political and regulatory developments. Use of leveraged commodity-linked derivatives creates an opportunity for increased return but, at the same time, creates the possibility for greater loss.
- Real estate investments trusts may be subject to a high degree of market risk because of concentration in a specific industry, sector or geographical sector. Real estate investments may be subject to risks including, but not limited to, declines in the value of real estate, risks related to general and economic conditions, changes in the value of the underlying property owned by the trust and defaults by borrower.
- Investment in alternative investment strategies is speculative, often involves a greater degree of risk than traditional investments including limited liquidity and limited transparency, among other factors and should only be considered by sophisticated investors with the financial capability to accept the loss of all or part of the assets devoted to such strategies.
- Structured products involve derivatives and risks that may not be suitable for all investors. The most common risks include, but are not limited to, risk of adverse or unanticipated market developments, issuer credit quality risk, risk of lack of uniform standard pricing, risk of adverse events involving any underlying reference obligations, risk of high volatility, risk of illiquidity/little to no secondary market, and conflicts of interest. Before investing in a structured product, investors should review the accompanying offering document, prospectus or prospectus supplement to understand the actual terms and key risks associated with the each individual structured product. Any payments on a structured product are subject to the credit risk of the issuer and/or guarantor. Investors may lose their entire investment, i.e., incur an unlimited loss. The risks listed above are not complete. For a more comprehensive list of the risks involved with this particular product, please speak to your J.P. Morgan team.
- As a reminder, hedge funds (or funds of hedge funds) often engage in leveraging and other speculative investment practices that may increase the risk of investment loss. These investments can be highly illiquid, and are not required to provide periodic pricing or valuation information to investors, and may involve complex tax structures and delays in distributing important tax information. These investments are not subject to the same regulatory requirements as mutual funds; and often charge high fees. Further, any number of conflicts of interest may exist in the context of the management and/or operation of any such fund. For complete information, please refer to the applicable offering memorandum.
- For informational purposes only -- J.P. Morgan Securities LLC does not endorse, advise on, transmit, sell or transact in any type of virtual currency. Please note: J.P. Morgan Securities LLC does not intermediate, mine, transmit, custody, store, sell, exchange, control, administer, or issue any type of virtual currency, which includes any type of digital unit used as a medium of exchange or a form of digitally stored value.
- The prices and rates of return are indicative, as they may vary over time based on market conditions.
- Additional risk considerations exist for all strategies.
- The information provided herein is not intended as a recommendation of or an offer or solicitation to purchase or sell any investment product or service.
- Opinions expressed herein may differ from the opinions expressed by other areas of J.P. Morgan. This material should not be regarded as investment research or a J.P. Morgan investment research report.
This material is for information purposes only, and may inform you of certain products and services offered by J.P. Morgan’s wealth management businesses, part of JPMorgan Chase & Co. (“JPM”). The views and strategies described in the material may not be suitable for all investors and are subject to investment risks. Please read all Important Information.
GENERAL RISKS & CONSIDERATIONS. Any views, strategies or products discussed in this material may not be appropriate for all individuals and are subject to risks. Investors may get back less than they invested, and past performance is not a reliable indicator of future results. Asset allocation/diversification does not guarantee a profit or protect against loss. Nothing in this material should be relied upon in isolation for the purpose of making an investment decision. You are urged to consider carefully whether the services, products, asset classes (e.g. equities, fixed income, alternative investments, commodities, etc.) or strategies discussed are suitable to your needs. You must also consider the objectives, risks, charges, and expenses associated with an investment service, product or strategy prior to making an investment decision. For this and more complete information, including discussion of your goals/situation, contact your J.P. Morgan team.
NON-RELIANCE. Certain information contained in this material is believed to be reliable; however, JPM does not represent or warrant its accuracy, reliability or completeness, or accept any liability for any loss or damage (whether direct or indirect) arising out of the use of all or any part of this material. No representation or warranty should be made with regard to any computations, graphs, tables, diagrams or commentary in this material, which are provided for illustration/reference purposes only. The views, opinions, estimates and strategies expressed in this material constitute our judgment based on current market conditions and are subject to change without notice. JPM assumes no duty to update any information in this material in the event that such information changes. Views, opinions, estimates and strategies expressed herein may differ from those expressed by other areas of JPM, views expressed for other purposes or in other contexts, and this material should not be regarded as a research report. Any projected results and risks are based solely on hypothetical examples cited, and actual results and risks will vary depending on specific circumstances. Forward-looking statements should not be considered as guarantees or predictions of future events.
Nothing in this document shall be construed as giving rise to any duty of care owed to, or advisory relationship with, you or any third party. Nothing in this document shall be regarded as an offer, solicitation, recommendation or advice (whether financial, accounting, legal, tax or other) given by J.P. Morgan and/or its officers or employees, irrespective of whether or not such communication was given at your request. J.P. Morgan and its affiliates and employees do not provide tax, legal or accounting advice. You should consult your own tax, legal and accounting advisors before engaging in any financial transactions.
LEGAL ENTITY, BRAND & REGULATORY INFORMATION
In the United States, bank deposit accounts and related services, such as checking, savings and bank lending, are offered by JPMorgan Chase Bank, N.A. Member FDIC.
J.P. Morgan Wealth Management is a business of JPMorgan Chase & Co., which offers investment products and services through J.P. Morgan Securities LLC (JPMS), a registered broker-dealer and investment adviser, member FINRA and SIPC. Insurance products are made available through Chase Insurance Agency, Inc. (CIA), a licensed insurance agency, doing business as Chase Insurance Agency Services, Inc. in Florida. Certain custody and other services are provided by JPMorgan Chase Bank, N.A. (JPMCB). JPMS, CIA and JPMCB are affiliated companies under the common control of JPMorgan Chase & Co. Products not available in all states.
Bank deposit accounts and related services, such as checking, savings and bank lending, are offered by JPMorgan Chase Bank, N.A. Member FDIC.
This document may provide information about the brokerage and investment advisory services provided by J.P. Morgan Securities LLC (“JPMS”). The agreements entered into with JPMS, and corresponding disclosures provided with respect to the different products and services provided by JPMS (including our Form ADV disclosure brochure, if and when applicable), contain important information about the capacity in which we will be acting. You should read them all carefully. We encourage clients to speak to their JPMS representative regarding the nature of the products and services and to ask any questions they may have about the difference between brokerage and investment advisory services, including the obligation to disclose conflicts of interests and to act in the best interests of our clients.
J.P. Morgan may hold a position for itself or our other clients which may not be consistent with the information, opinions, estimates, investment strategies or views expressed in this document. JPMorgan Chase & Co. or its affiliates may hold a position or act as market maker in the financial instruments of any issuer discussed herein or act as an underwriter, placement agent, advisor or lender to such issuer.


Check the background of our firm and investment professionals on FINRA's BrokerCheck
To learn more about J. P. Morgan Wealth Management’s investment business, including our accounts, products and services, as well as our relationship with you, please review our J.P. Morgan Securities LLC Form CRS and Guide to Investment Services and Brokerage Products.
This website is for informational purposes only, and not an offer, recommendation or solicitation of any product, strategy service or transaction. Any views, strategies or products discussed on this site may not be appropriate or suitable for all individuals and are subject to risks. Prior to making any investment or financial decisions, an investor should seek individualized advice from a personal financial, legal, tax and other professional advisors that take into account all of the particular facts and circumstances of an investor's own situation.
This website may provide information about the brokerage and investment advisory services provided by J.P. Morgan Securities LLC ("JPMS"). When JPMS acts as a broker-dealer, a client's relationship with us and our duties to the client will be different in some important ways than a client's relationship with us and our duties to the client when we are acting as an investment advisor. A client should carefully read the agreements and disclosures received (including our Form ADV disclosure brochure, if and when applicable) in connection with our provision of services for important information about the capacity in which we will be acting.
INVESTMENT AND INSURANCE PRODUCTS ARE:
• NOT FDIC INSURED • NOT INSURED BY ANY FEDERAL GOVERNMENT AGENCY • NOT A DEPOSIT OR OTHER OBLIGATION OF, OR GUARANTEED BY, JPMORGAN CHASE BANK, N.A. OR ANY OF ITS AFFILIATES • SUBJECT TO INVESTMENT RISKS, INCLUDING POSSIBLE LOSS OF THE PRINCIPAL AMOUNT INVESTED

J.P. Morgan Wealth Management is a business of JPMorgan Chase & Co., which offers investment products and services through J.P. Morgan Securities LLC (JPMS), a registered broker-dealer and investment adviser, member FINRA and SIPC Insurance products are made available through Chase Insurance Agency, Inc. (CIA), a licensed insurance agency, doing business as Chase Insurance Agency Services, Inc. in Florida. Certain custody and other services are provided by JPMorgan Chase Bank, N.A. (JPMCB). JPMS, CIA and JPMCB are affiliated companies under the common control of JPMorgan Chase & Co. Products not available in all states.
Please read additional Important Information in conjunction with these pages.
You're now leaving J.P. Morgan
J.P. Morgan’s website and/or mobile terms, privacy and security policies don’t apply to the site or app you're about to visit. Please review its terms, privacy and security policies to see how they apply to you. J.P. Morgan isn’t responsible for (and doesn’t provide) any products, services or content at this third-party site or app, except for products and services that explicitly carry the J.P. Morgan name.